Manual reporting is a tax on engineering time. Every hour spent pulling CSVs from ten different platforms, stitching them together in a spreadsheet, and emailing the result is an hour not spent building things that matter. The process is brittle, prone to human error, and doesn’t scale. We are going to architect a system that bypasses this manual drudgery entirely.
This is not a theoretical exercise. This is a blueprint for an automated pipeline that pulls data from source APIs, transforms it, loads it into a data warehouse, and pushes it to a visualization layer. The goal is a report that builds itself, on time, every time, with alerts that scream the moment something breaks.
The Architectural Skeleton
Forget all-in-one platforms that promise the world and deliver a locked-in ecosystem. We assemble our own stack for control and transparency. The components are interchangeable, but the logic remains the same. A typical setup involves a script, a scheduler, a warehouse, and a dashboard.
- Extraction & Transformation: Python. It has a library for everything, its data manipulation with Pandas is straightforward, and it runs anywhere.
- Orchestration: A serverless function like AWS Lambda or Google Cloud Functions. They are cheap, stateless, and triggered by a simple cron schedule. No need to maintain a dedicated server just to run a script once a day.
- Storage: A proper data warehouse. Google BigQuery or Snowflake are the usual suspects. They separate storage from compute and can handle complex queries without buckling. A standard SQL database will eventually choke.
- Visualization: Looker Studio (formerly Data Studio) or Tableau. We just need something that can query the warehouse directly and has scheduling features.
This stack keeps costs directly tied to usage. If it doesn’t run, you don’t pay. That’s a hell of a lot better than a monthly subscription for a tool you only use 1% of the time.
Phase 1: Gutting the Data From the Source APIs
The first point of failure is always the source. Every ad platform API has its own authentication method, its own rate limits, and its own special kind of flakiness. Your job is to write a defensive script that anticipates this. You need API keys, OAuth2 credentials, and a developer account for each platform you intend to query.
Let’s take Google Ads as the example. You’ll use the `google-ads-api` library. Your script needs to handle the OAuth2 flow to get a refresh token, which you then store securely. Do not hardcode credentials in your script. Use a secret manager like AWS Secrets Manager or Google Secret Manager.
Connecting and Querying
The query itself is written in Google Ads Query Language (GAQL), which looks a lot like SQL. You construct a query to pull the specific metrics and dimensions you need for a given time frame. A common mistake is pulling too much data or making too many small requests. Batch your requests and only ask for the fields you will actually use.
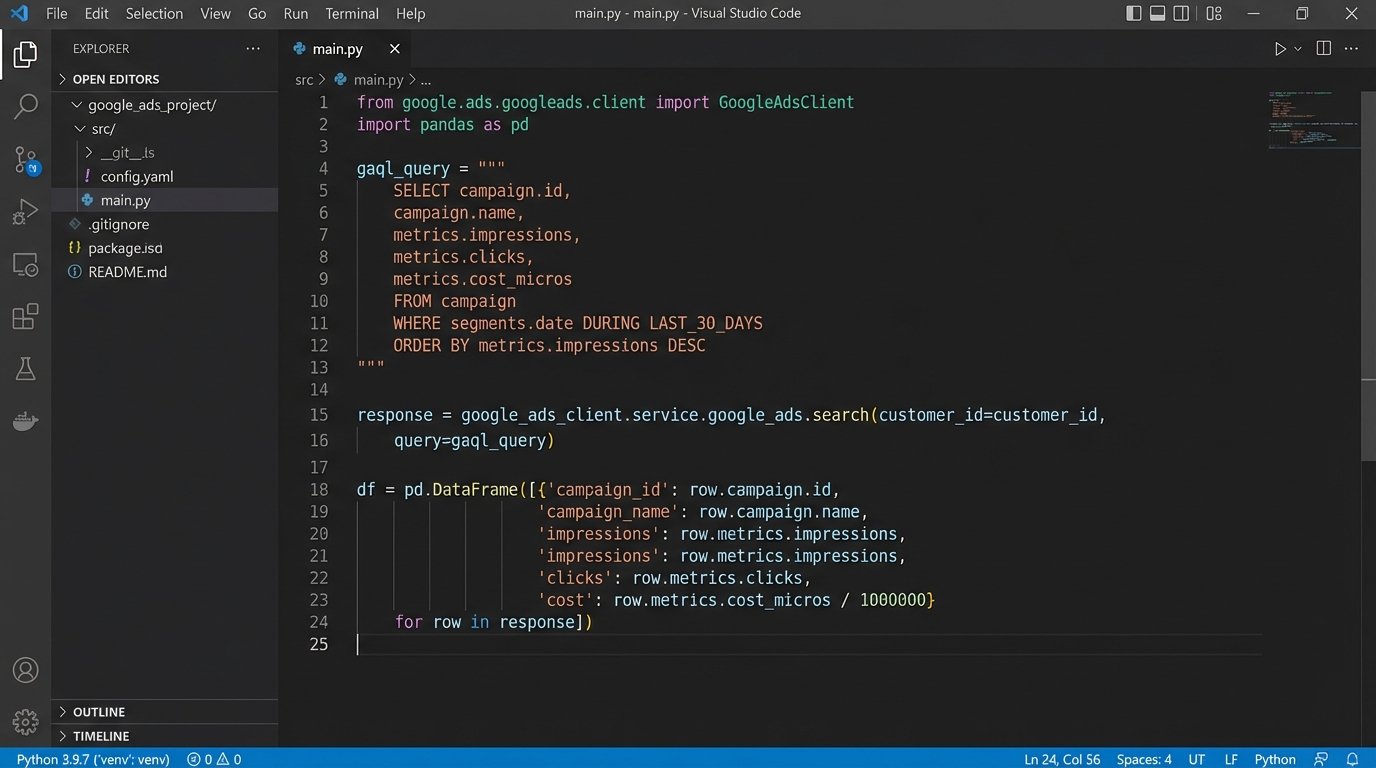
This script below is a stripped-down example. It shows the core logic for initializing the client and executing a basic query. It doesn’t include pagination or robust error handling, which you will absolutely need to build.
from google.ads.googleads.client import GoogleAdsClient

from google.ads.googleads.errors import GoogleAdsException
# Assumes google-ads.yaml is configured in your home directory
googleads_client = GoogleAdsClient.load_from_storage()
def get_campaign_data(client, customer_id):
ga_service = client.get_service("GoogleAdsService")
query = """
SELECT
campaign.name,
metrics.impressions,
metrics.clicks,
metrics.cost_micros
FROM campaign
WHERE segments.date BETWEEN 'YYYY-MM-DD' AND 'YYYY-MM-DD'
"""
stream = ga_service.search_stream(customer_id=customer_id, query=query)
# Process results here...
for batch in stream:
for row in batch.results:
# Convert cost from micros to standard currency
cost = row.metrics.cost_micros / 1000000
print(f"Campaign: {row.campaign.name}, Clicks: {row.metrics.clicks}, Cost: {cost}")
# Error handling is mandatory, not optional.
try:
# Replace with your actual customer ID
get_campaign_data(googleads_client, "INSERT_CUSTOMER_ID_HERE")
except GoogleAdsException as ex:
print(f"Request failed with status {ex.error.code().name}")
# Add retry logic or alerting here
The API will not give you clean data. It will give you `cost_micros`, which you must convert. It will give you resource names you might have to parse. The script is the first line of defense for data sanity.
Phase 2: Forcing Data Into a Standard Schema
You now have raw data from one or more sources. It’s useless in its current state. Facebook calls it `spend`, Google calls it `cost_micros`, and LinkedIn calls it `costInLocalCurrency`. Your job is to force this chaos into a single, unified schema before it ever touches your warehouse.
We use a data transformation step, typically with Pandas within the same Python script. We create a DataFrame, rename columns to a standard convention (`platform`, `campaign_name`, `report_date`, `impressions`, `clicks`, `spend`), and perform necessary type conversions. This is also where you add any custom dimensions, like mapping campaign naming conventions to specific business units.
Schema Enforcement
Do not let the pipeline load data with a mismatched schema. It pollutes the warehouse and breaks every downstream dashboard. Before the load step, logic-check the DataFrame’s columns against a predefined schema definition. If a column is missing or has the wrong data type, the script should fail loudly and send an alert. A silent failure that loads bad data is infinitely worse than a noisy one that loads nothing.
Trying to normalize data from three different ad platforms is like trying to fit a truck engine, a motorcycle engine, and a lawnmower engine onto the same chassis using a single set of bolts. Nothing lines up. You have to fabricate adapter plates and custom brackets. That’s what this transformation code does, it builds the adapters so all the parts can be bolted into one unified structure in the warehouse.
Once transformed, the data is ready to be loaded. We typically save the cleaned DataFrame to a CSV or Parquet file, upload it to a staging area like an S3 bucket or Google Cloud Storage, and then issue a load command to the data warehouse. This decouples the transformation from the load, making it easier to debug and re-run failed steps.
Phase 3: Orchestration and Productionalizing the Pipeline
A script on your local machine is not automation. Automation requires a scheduler and an environment. This is where serverless functions come in. We package our Python script, along with its dependencies, into a deployment package for AWS Lambda or Google Cloud Functions.
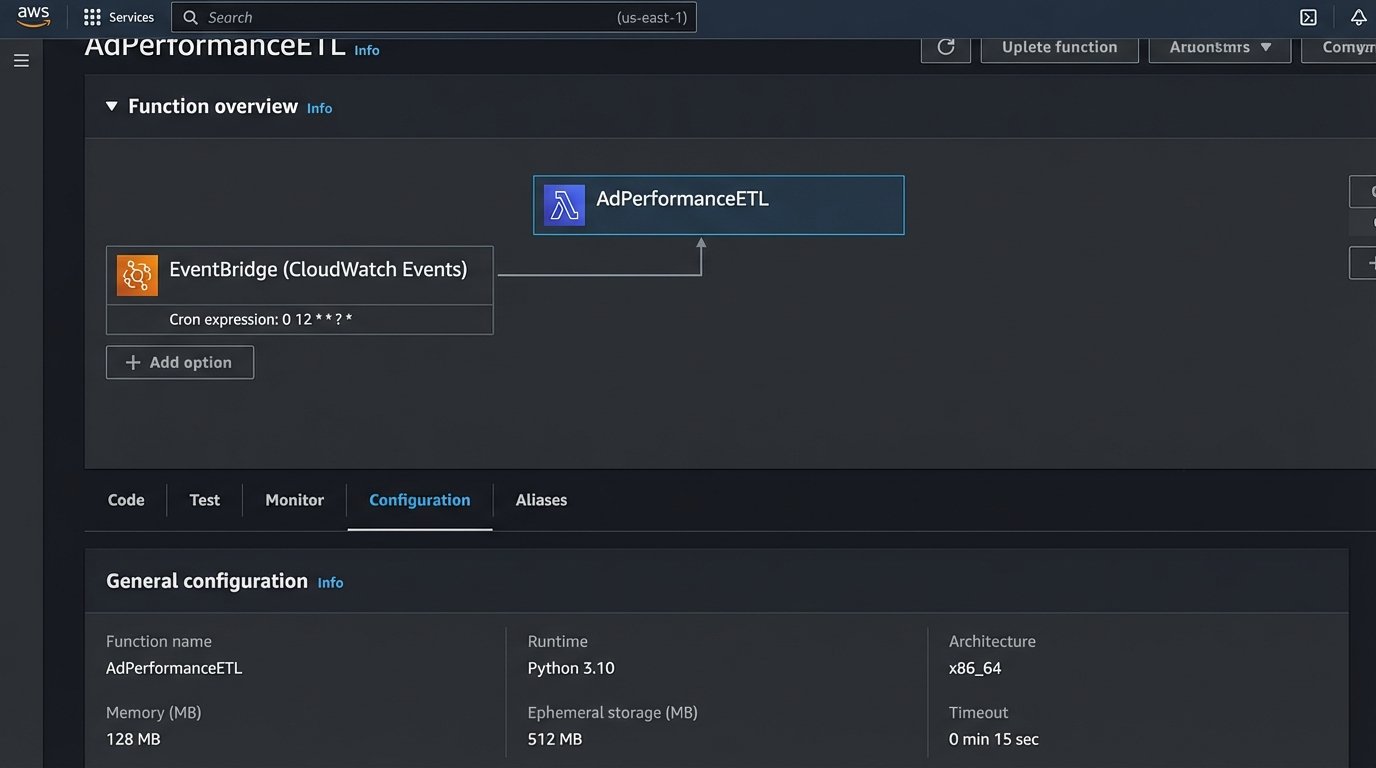
The function is configured with a trigger. For daily reports, a simple cron schedule is sufficient. For instance, `0 5 * * *` will run the function every day at 5 AM UTC. This timing is important. You want to run it after all the data for the previous day is finalized by the ad platforms, which can sometimes take a few hours past midnight.
Logging and Alerting Are Not Optional
Your function must have structured logging. Every run should output its status, the date range it processed, and the number of rows it extracted. All logs should be shipped to a centralized logging service like CloudWatch or Google Cloud Logging. You need to be able to trace a single run from start to finish without SSHing into anything.
You also need alerts. Set up a trigger, for example using SNS or Pub/Sub, that fires an alert to a Slack channel or an email address on any function failure. The alert must contain the specific error message from the logs. “The pipeline failed” is a useless notification. “Pipeline failed: Google Ads API returned INVALID_CUSTOMER_ID” tells an engineer exactly where to start looking.
Phase 4: Visualization and Automated Delivery
The warehouse now contains clean, structured, and up-to-date data. The final step is to connect the visualization tool. You provide Looker Studio or Tableau with read-only credentials to your data warehouse. Do not give it write access. Ever.
Inside the tool, you write a SQL query that pulls the data for your report. Since all the transformation is already done, this query should be simple. It’s usually a `SELECT * FROM your_table WHERE date = …`. You build the charts and tables once to create a report template. The tool handles refreshing the data from the warehouse on its own schedule.
Bypassing the Dashboard Entirely
Most stakeholders don’t want to log into another dashboard. They want a PDF in their inbox. Most enterprise-grade visualization tools have a built-in scheduling feature. You can configure it to email a PDF or PNG of the dashboard to a specific distribution list every morning. The data is pulled, the report is generated, and the email is sent with zero human intervention.
This closes the loop. The automation doesn’t just handle the data pipeline, it handles the final delivery. The only time a human needs to touch the system is when an alert fires because something upstream broke.

Maintainability and Dealing With Upstream Breaks
APIs change. A field you rely on will get deprecated. A new required parameter will be added without warning. A solid pipeline anticipates this. Your code should not be a single monolithic script. Break down extraction logic for each data source into its own module. When the Facebook API changes, you only have to touch the Facebook module, not the entire codebase.
The cost of running this infrastructure is another consideration. Serverless functions and data warehousing are not free. While generally cheaper than a dedicated server, a poorly written query or an inefficient script can become a wallet-drainer. Monitor your cloud costs closely, especially in the first few months. Set up billing alerts to catch unexpected spikes in usage before they become a problem at the end of the month.
This kind of automation isn’t a one-time setup. It’s a system that requires periodic maintenance. But the payoff is immense. It reclaims hundreds of hours of manual labor and provides more reliable data. It replaces the fragile, error-prone process of downloading and merging CSVs with a resilient, observable system that just works.