The term “automated reporting” is mostly marketing fiction. The reality is a patchwork of brittle API connections, mismatched data schemas, and scheduled scripts that fail silently. True automation isn’t about buying a dashboard. It’s about forcing systems to communicate that were never designed to, then building a reporting layer that can survive the next unannounced API change. Here are ten tools and platforms realtors use to build these systems, along with the technical debt they introduce.
1. Follow Up Boss
This is a real estate CRM that doesn’t completely lock down its data. Its primary value for reporting automation is its API and webhook support. You can configure webhooks to fire on events like “New Lead” or “Deal Stage Changed,” pushing a JSON payload to a specified endpoint. This allows for near real-time data capture without constant API polling.
The reporting you get out-of-the-box is elementary. To do any serious analysis, you have to extract the data. We pipe these webhooks into a AWS Lambda function that normalizes the JSON and dumps it into a PostgreSQL database. From there, we can run queries that the native interface chokes on, like multi-touch lead source attribution over a two-year period.
Technical Use Case:
Agent Performance Dashboards. Use the API to pull call logs, email volume, and deal progression data for each agent. Aggregate this data to calculate lead response times and conversion rates by source. The API rate limits are survivable, but batch your requests and build in retry logic.
It’s a CRM first, not a data warehouse. Don’t expect miracles.
2. Tableau
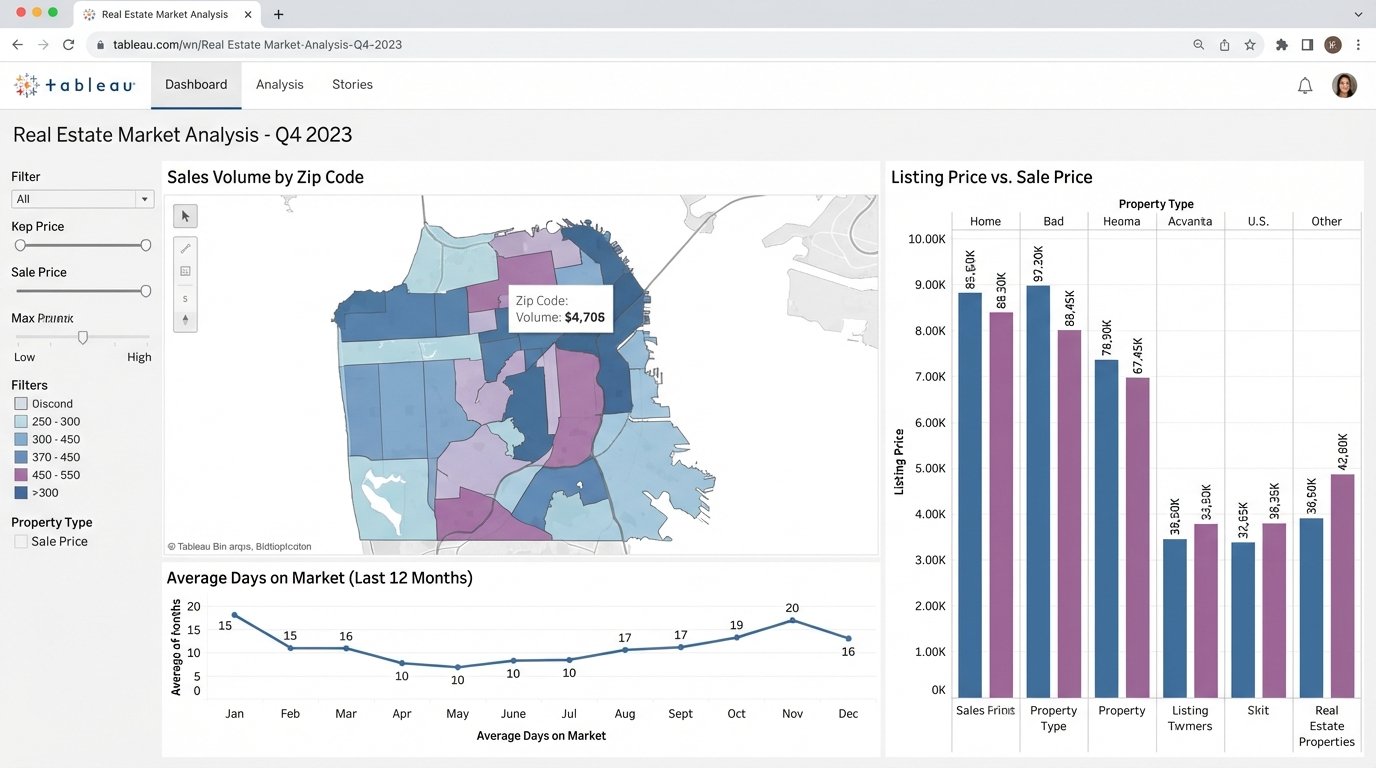
Tableau is the heavy machinery for data visualization. You point it at a clean data source, and it can build almost any report you can imagine. For real estate, its strength is connecting to multiple data sources simultaneously. You can join your CRM data from Follow Up Boss with transaction data exported from your MLS and financial data from QuickBooks.
This is a wallet-drainer. The licensing cost is significant, and you need someone who actually knows how to operate it. Giving Tableau to a team without a data analyst is like giving a crane to a house painter. The tool is only as good as the underlying data structure and the operator’s skill.
Technical Use Case:
Market Trend Analysis. Connect Tableau to a database fed by MLS data exports. You can map days-on-market against listing price changes, visualize sales volume by zip code, and track inventory levels over time. This requires a stable ETL process to pull MLS data, as direct connections are often unreliable or non-existent.
Without clean data, it just makes expensive, pretty charts of garbage.
3. Looker Studio (Formerly Google Data Studio)
Looker Studio is the free alternative to Tableau. Its main appeal is its native integration with the Google ecosystem. If your brokerage runs on Google Sheets and Google Ads, you can spin up a functional dashboard in an afternoon. It has a library of third-party connectors for other platforms like Facebook Ads or various CRMs.
Many of these “partner” connectors are sluggish and unreliable. They often break after the source platform updates its API. For anything serious, you will end up piping your data into a Google BigQuery instance or even a simple Google Sheet, then connecting Looker Studio to that. The tool is free, but the data engineering to make it work is not.
Technical Use Case:
Marketing Campaign ROI. Connect Looker Studio to Google Analytics, Google Ads, and a Google Sheet containing your lead data with a “source” column. You can build a report that joins ad spend with generated leads and closed deals to get a rough cost-per-acquisition.
This setup is fragile. One changed column name in the source sheet breaks the entire dashboard.
4. Airtable
Airtable functions as a database for people who are scared of databases. It combines the approachability of a spreadsheet with relational data capabilities. For reporting, it serves as an excellent staging area. You can build automation pipelines that pull data from multiple sources via its API and consolidate it into a single, clean Airtable base.
Its own reporting blocks are weak. The real power is using Airtable as a central hub, then connecting a proper visualization tool like Tableau or Looker Studio to its API. Performance degrades noticeably once you get past 50,000 records in a single base, so it is not a solution for large-scale historical data analysis.
Technical Use Case:
Transaction Coordination Tracking. Create a base to track every deal from contract to close. Use Airtable’s own automations or an external tool like Make to create tasks, send reminders, and update statuses. The resulting structured data provides a clean log for reporting on transaction cycle times and identifying bottlenecks.
It’s a flexible data store, not a high-performance database.
5. Make (Formerly Integromat)
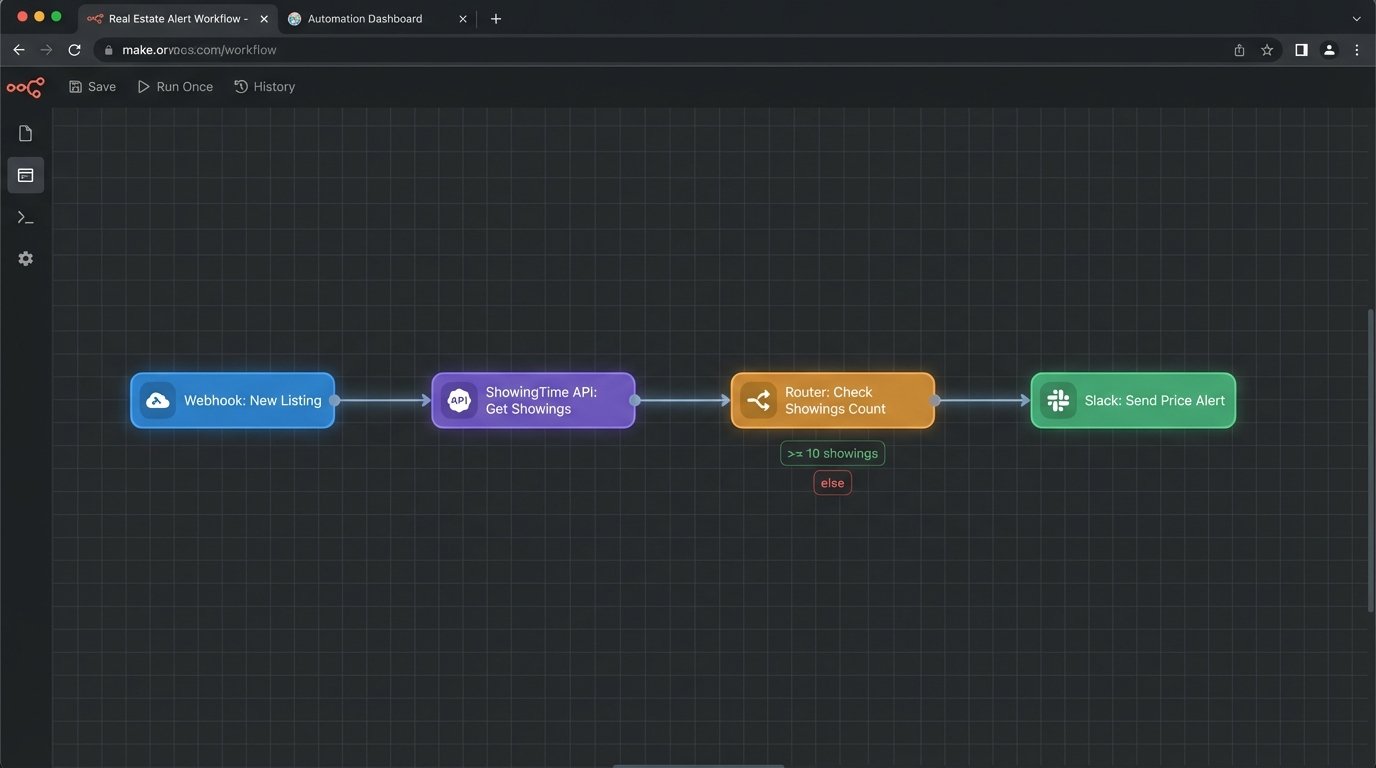
Make and its competitor Zapier are the duct tape of the internet. They bridge systems that have no native integration. You can build a “scenario” that watches for a new lead in your CRM, enriches it with data from another source, sends a Slack notification, and creates a calendar event. It is a visual automation builder that translates user actions into a series of API calls.
These platforms create complex, invisible dependencies. When a scenario fails, debugging is a nightmare of checking execution logs and deciphering cryptic API error messages. They also charge by the “operation,” which can get expensive fast if you are processing a high volume of data. It’s like trying to move a river with a bucket brigade. It works, but it’s inefficient at scale.
Technical Use Case:
Lead Routing Logic. A new lead arrives via a webhook from your website. Make catches the payload, logic-checks the zip code or price point, and then routes the lead to the correct agent’s calendar and CRM inbox via API calls. This automates distribution without writing custom code.
A great way to build a prototype, a terrible way to run a critical production system.
6. A Custom Python Script
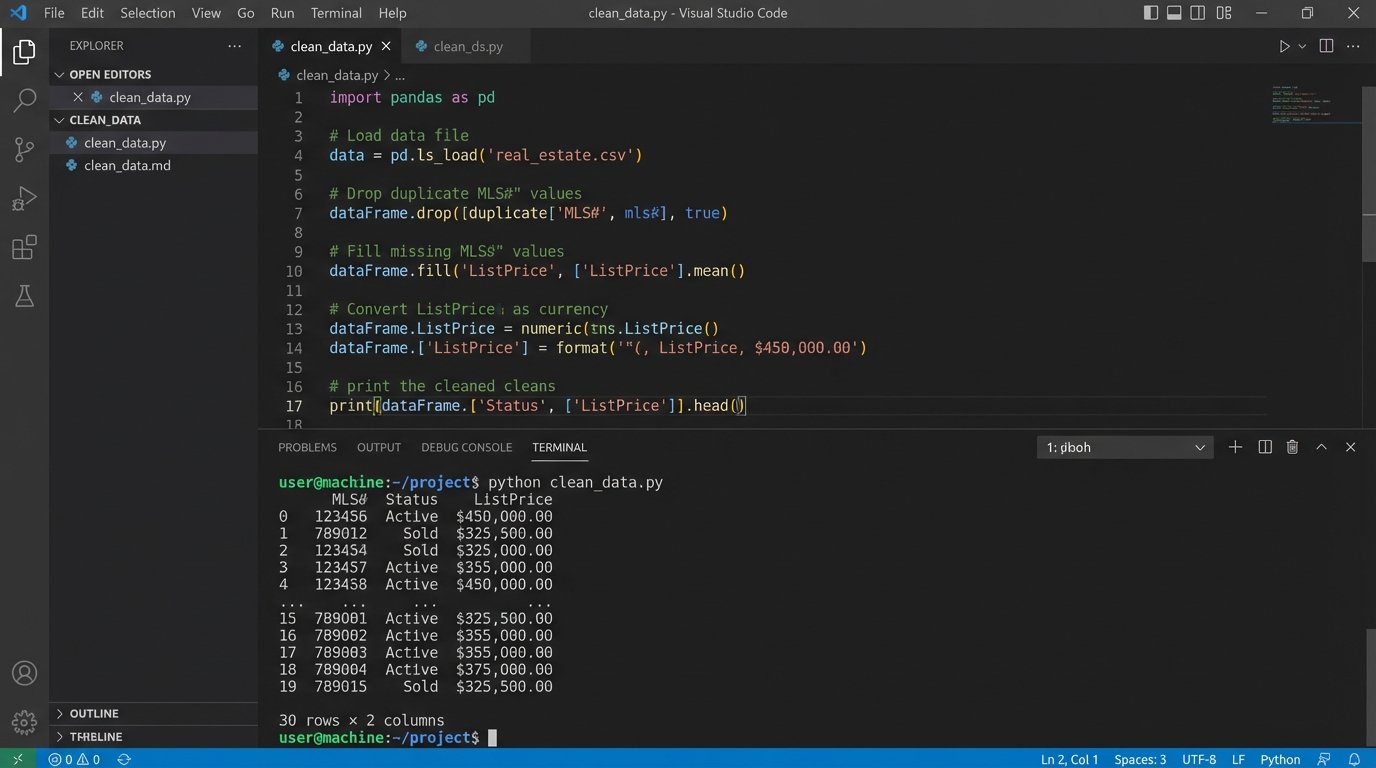
Sometimes, off-the-shelf tools just add layers of abstraction over the real problem. A Python script using libraries like `requests` for API calls and `pandas` for data manipulation gives you absolute control. You can pull data from any source with an API, clean and transform it exactly as needed, and output it to a CSV, a database, or another API.
This approach requires a developer. You are responsible for hosting, scheduling (e.g., via a cron job on a Linux server), error handling, and maintenance. There is no user interface. When the MLS changes its export format, your script breaks, and you are the one who has to fix it at 2 AM.
Technical Use Case:
MLS Data Aggregation. Write a script that logs into the MLS portal, exports the daily “hotsheet” as a CSV, loads it into a pandas DataFrame, cleans up inconsistent agent names, standardizes addresses, and appends the new listings to a master database for historical analysis.
import pandas as pd

# Assume 'mls_export.csv' is the raw data file
try:
    df = pd.read_csv('mls_export.csv')

    # Strip whitespace from column names
    df.columns = df.columns.str.strip()

    # Normalize a 'Status' column
    df['Status'] = df['Status'].str.lower().replace({'active': 'A', 'pending': 'P', 'sold': 'S'})

    # Force price column to be numeric, errors become Not a Number (NaN)
    df['ListPrice'] = pd.to_numeric(df['ListPrice'], errors='coerce')

    # Drop rows where the price could not be converted
    df.dropna(subset=['ListPrice'], inplace=True)

    print(df[['MLS#', 'Status', 'ListPrice']].head())

except FileNotFoundError:
    print("Error: MLS export file not found.")
This is the most powerful but also the most brittle solution.
7. Propertybase
Built on top of Salesforce, Propertybase is an enterprise-grade platform. Its reporting capabilities are dictated by the underlying Salesforce engine, which is both powerful and complex. You are not just building reports; you are writing Salesforce Object Query Language (SOQL) queries to pull data from various related objects (Contacts, Properties, Deals).
This is overkill for a small team. The platform is expensive, and finding developers who understand both real estate workflows and the Salesforce data model is difficult. You can build incredibly detailed reports, but you will pay a steep price in both money and complexity to get there.
Technical Use Case:
Commission Forecasting. Create a report that queries deal objects. Join them with agent data and commission split information. You can then group deals by their projected closing date and stage probability to build a weighted pipeline forecast for the next quarter.
You get the power of Salesforce, along with all of its baggage.
8. BrokerMetrics
This tool sits on top of MLS data to provide market share and agent productivity analysis. It does the initial data aggregation and cleaning for you. The product is designed to answer questions like, “Which agents in my market have the highest sales volume in the $500k-$750k price range?”
The reports are mostly canned. You get the metrics the platform decides are important. Exporting the raw, underlying data for use in your own systems is often restricted or impossible. You are using their interface and their calculations, which limits the depth of custom analysis you can perform.
Technical Use Case:
Recruiting Analysis. Run a report to identify top-producing agents at competing brokerages. Filter by transaction volume, geographic area, or property type. The data is used to build a target list for your recruiting efforts.
It gives you answers, but it hides the underlying data.
9. ShowingTime
ShowingTime automates the logistics of property showings. While not a traditional reporting tool, its data is a valuable source for gauging property interest and agent activity. Its API allows you to extract data about the number of showings requested, agent feedback, and showing frequency per listing.
The data is tactical, not strategic. It tells you how many people walked through a specific house, but it does not tell you much about the broader market. You need to pull this data and join it with your MLS and CRM data to create a complete picture of a property’s journey from listing to sale.
Technical Use Case:
Listing Price Adjustment Triggers. Set up an automated process to monitor showings per listing. If a property gets more than 20 showings in its first week with no offers, trigger an alert to the listing agent suggesting a conversation about price. Conversely, if a property gets zero showings in 10 days, trigger a mandatory price review.
The data is useful, but only after you extract it and combine it with other sources.
10. Inside Real Estate (kvCORE)
This is a massive, all-in-one platform that includes a website, CRM, and marketing automation. The appeal is having everything in one system. The reporting module provides dashboards for lead generation, agent accountability, and business analytics. It aims to be a single source of truth for a brokerage.
These walled-garden platforms are notoriously difficult to extract data from. While they offer their own reporting, you are limited to their pre-built visualizations and metrics. Getting your data out to feed a custom data warehouse or an advanced tool like Tableau is often a fight with poor documentation and limited API endpoints.
Technical Use Case:
Behavioral Lead Scoring. Use the internal reporting to track how leads interact with your website. kvCORE can monitor property views, saved searches, and email opens. This data is used to automatically score and segment leads, bubbling the most engaged prospects to the top of an agent’s call list.
You trade control and flexibility for the convenience of an integrated system.