Client reporting is the tedious backbone of any agency. For one of our partners, it was a systemic failure. Their process involved manually pulling data from Google Analytics 4, Google Ads, Search Console, and their CRM. Analysts, whose time is expensive, spent the first three days of every month copying and pasting numbers into a sprawling spreadsheet template.
The output was a static PDF, prone to human error, and delivered late. The cost was not just the 8 hours per client, multiplied by 20 clients. The real cost was the opportunity cost. Analysts were paid to find insights, not to verify that cell B5 correctly matched a line item from a CSV export. This entire workflow was a candidate for demolition.
The Problem: A Manual Rube Goldberg Machine
The existing system was a masterclass in inefficiency. An analyst would open a dozen browser tabs for each client. They would set date ranges, apply filters, export to CSV, and then meticulously transfer the key metrics into a master Google Sheet. This sheet was burdened with volatile formulas and cross-sheet references that broke if someone breathed on them too hard.
Data consistency was a fantasy. One analyst might pull “Sessions” from GA4, while another pulled “Users”. The definition of a “lead” varied depending on who ran the report. The final product was a report that clients questioned, and the team couldn’t fully trust. It was a time-sink that produced a low-value, high-risk asset.
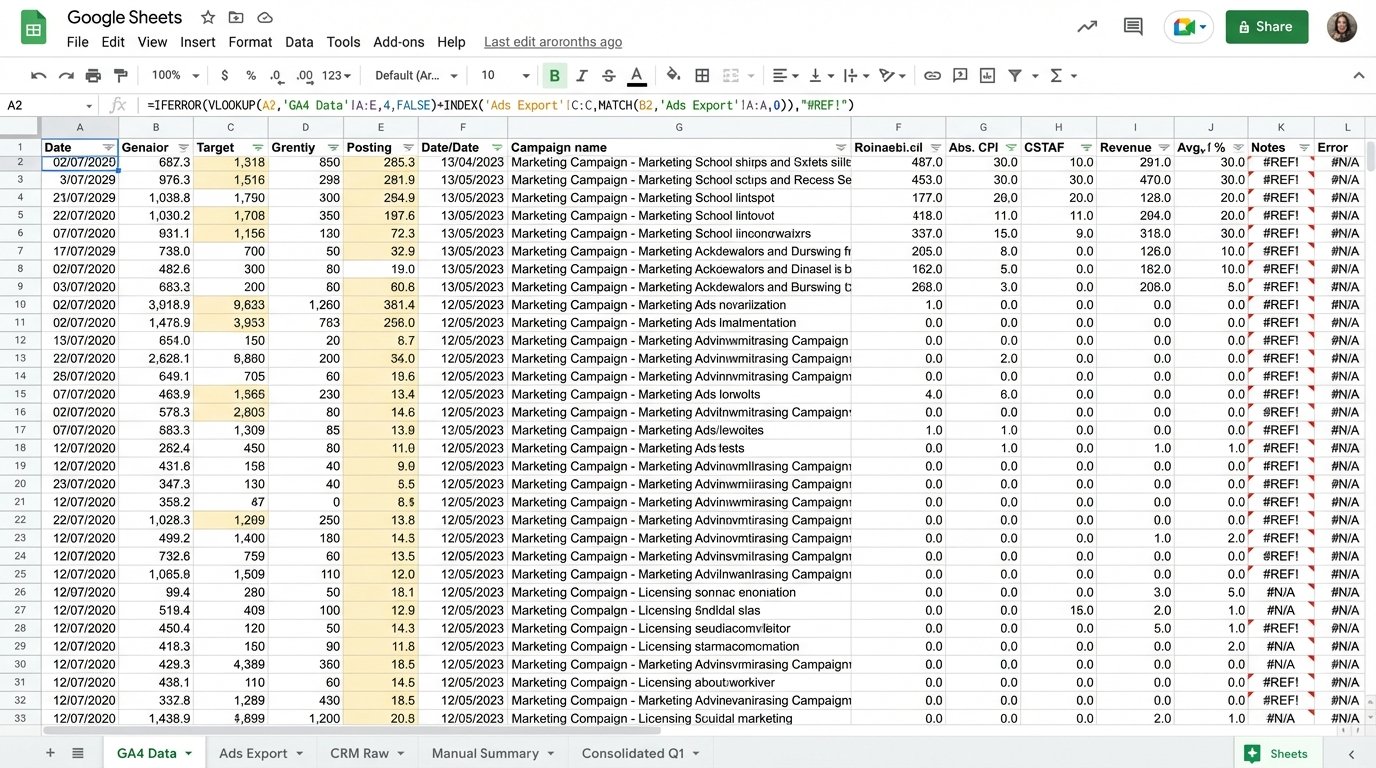
The breaking point came when a major client flagged a 20% discrepancy in their reported ROAS. The cause was a copy-paste error made at 10 PM on a Sunday night. The team spent the next day forensically rebuilding the report, destroying client trust and internal morale in the process. The mandate was clear: automate the entire data pipeline or lose valuable accounts.
The Architecture of the Fix: API Calls, BigQuery, and SQL
We rejected off-the-shelf reporting tools. Most are glorified dashboard builders that just hide the underlying API chaos and charge a fortune for it. They also lack the flexibility to handle custom logic. Instead, we built a lean, durable extraction and transformation pipeline using Python and Google Cloud Platform.
The solution has three core components.
- Extraction: A set of Python scripts, orchestrated by Google Cloud Functions, that run on a nightly schedule. Each script targets a specific API endpoint.
- Warehousing: All raw, extracted data is dumped into Google BigQuery. We don’t transform it on the fly. We get the raw data into a stable environment first.
- Transformation & Visualization: SQL views inside BigQuery join and clean the data. Google Looker Studio connects directly to these curated views, not the raw tables.
This separation of concerns is critical. If an API breaks, only the extraction layer is affected. The historical data in BigQuery remains intact, and the dashboards still function with the last good data pull. It builds resilience into a process that depends on external services.
Step 1: Gutting the Data Sources with Python
The extraction scripts are the workhorses. We used the official Google API Python Client Libraries to handle authentication and requests. The GA4 Data API is notoriously more verbose than the old Universal Analytics API, requiring specific dimension and metric objects. You can’t just throw strings at it.
Here is a stripped-down example of a request body for pulling session data from the GA4 Data API. This is not the full script, but it demonstrates the structure required to get a simple query to execute. Notice the explicit declaration of every dimension, metric, and date range.
    from google.analytics.data_v1beta import BetaAnalyticsDataClient

    from google.analytics.data_v1beta.types import (

        DateRange,

        Dimension,

        Metric,

        RunReportRequest,

    )
def sample_run_report(property_id="YOUR-GA4-PROPERTY-ID"):
"""Runs a simple report on a Google Analytics 4 property."""
client = BetaAnalyticsDataClient()
request = RunReportRequest(
property=f"properties/{property_id}",
dimensions=[Dimension(name="sessionSourceMedium")],
metrics=[
Metric(name="sessions"),
Metric(name="totalUsers"),
Metric(name="conversions")
],
date_ranges=[DateRange(start_date="2024-01-01", end_date="today")],
)
response = client.run_report(request)
# Logic to parse the response and load to BigQuery would follow.
print("Report result:")
for row in response.rows:
print(row.dimension_values[0].value, row.metric_values[0].value)
We built similar functions for the Google Ads API (to pull cost, clicks, and impressions) and the Search Console API (for query and ranking data). Each function authenticates, builds a request, handles pagination because APIs never give you everything at once, and then pushes the raw JSON or CSV data into a corresponding BigQuery table. No processing, just a straight data dump.
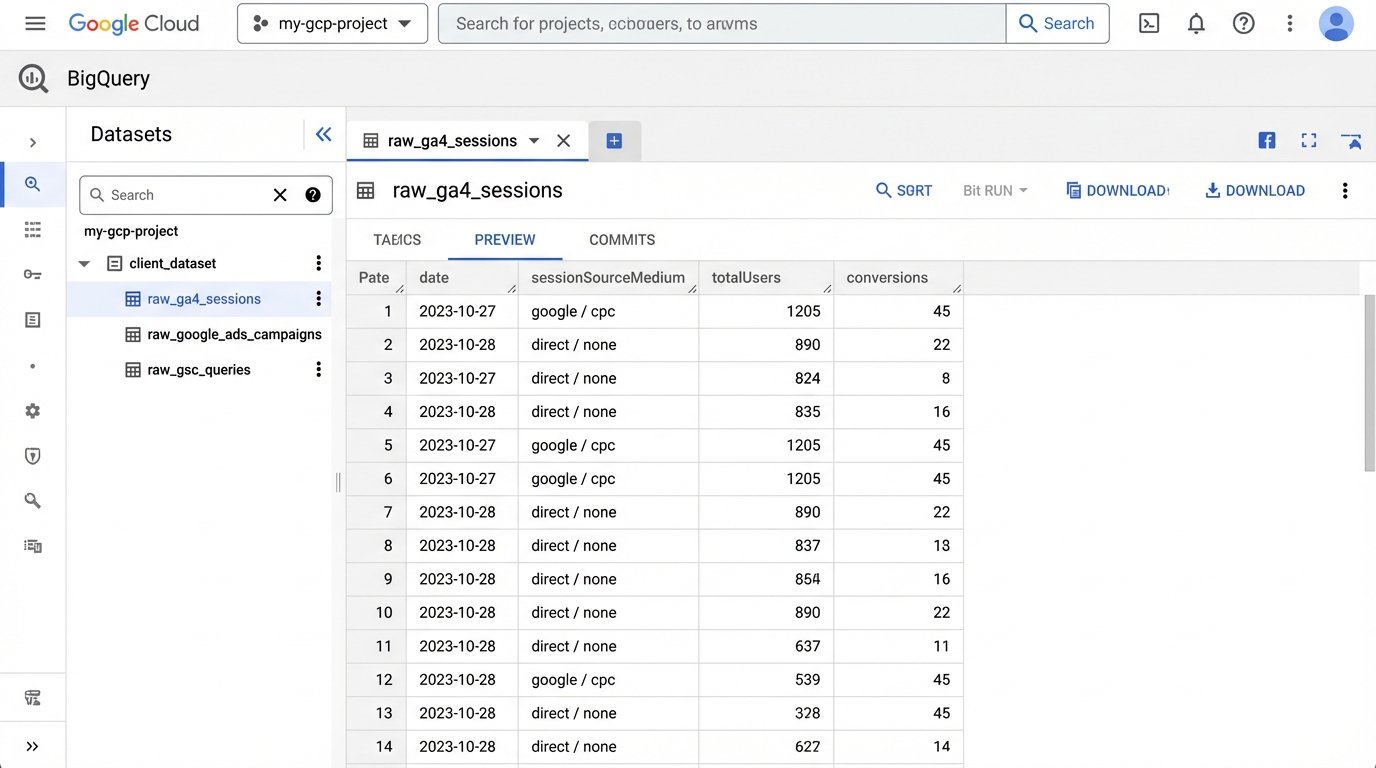
Step 2: Centralizing Chaos in BigQuery
Why BigQuery? Because it’s cheap for storage and built to handle the messy, semi-structured data that APIs spit out. We created a separate dataset for each client. Inside each dataset, we have raw tables like `raw_ga4_sessions`, `raw_google_ads_campaigns`, and `raw_gsc_queries`. The schema is often set to auto-detect on the first load.
This approach is fundamentally a staging area. Trying to join uncleaned, multi-source data directly in a BI tool is like trying to assemble a car engine with parts from a lawnmower. It might look like it fits, but it’s going to explode on the highway. The staging tables give us a stable foundation to build our logic on top of.
This is the most critical and most overlooked step. You must own your data, and that means having your own copy of it in a warehouse you control.
Step 3: Forcing Order with SQL Views
The magic happens in the SQL layer. Once the raw data is in BigQuery, we use SQL to create clean, aggregated views that will power the final dashboard. This is where we codify the agency’s business logic. We join Ads cost data to GA4 session data using the `gclid` parameter. We map CRM deal stages back to user traffic sources. We standardize naming conventions.
For example, a simplified view might look like this:
    CREATE OR REPLACE VIEW `project.client_dataset.v_channel_performance` AS

    SELECT

      ga.date,

      ga.sessionSourceMedium,

      SUM(ga.sessions) AS sessions,

      SUM(ga.conversions) AS conversions,

      SUM(ads.cost) AS cost,

      SUM(ads.clicks) AS clicks

    FROM

      `project.client_dataset.raw_ga4_sessions` AS ga

    LEFT JOIN

      `project.client_dataset.raw_google_ads_campaigns` AS ads

    ON

      ga.date = ads.date AND ga.campaignName = ads.campaignName

    GROUP BY

      1, 2
This SQL query creates a virtual table that Looker Studio can connect to. It’s fast, maintainable, and all the logic is in one place. If the definition of a key metric changes, we update one SQL view, and every report is instantly corrected. There is no more hunting through spreadsheet formulas.
The Results: More Than Just Time Saved
The initial goal was to reduce the 160 hours spent monthly on this drudgery. The final system reduced that time to less than 10 hours per month. This new time is spent on quality assurance and spot-checking the automated dashboards. The 150-hour savings translated directly into over $20,000 a month in reclaimed analyst time.
The true ROI was in the quality of the work. Analysts were liberated from data entry. They started spending their time on what they were hired for: analysis. They could now answer complex questions that were impossible before. “What is our true, blended ROAS across paid search and organic traffic for Q2?” The data was available in a trusted, unified view.
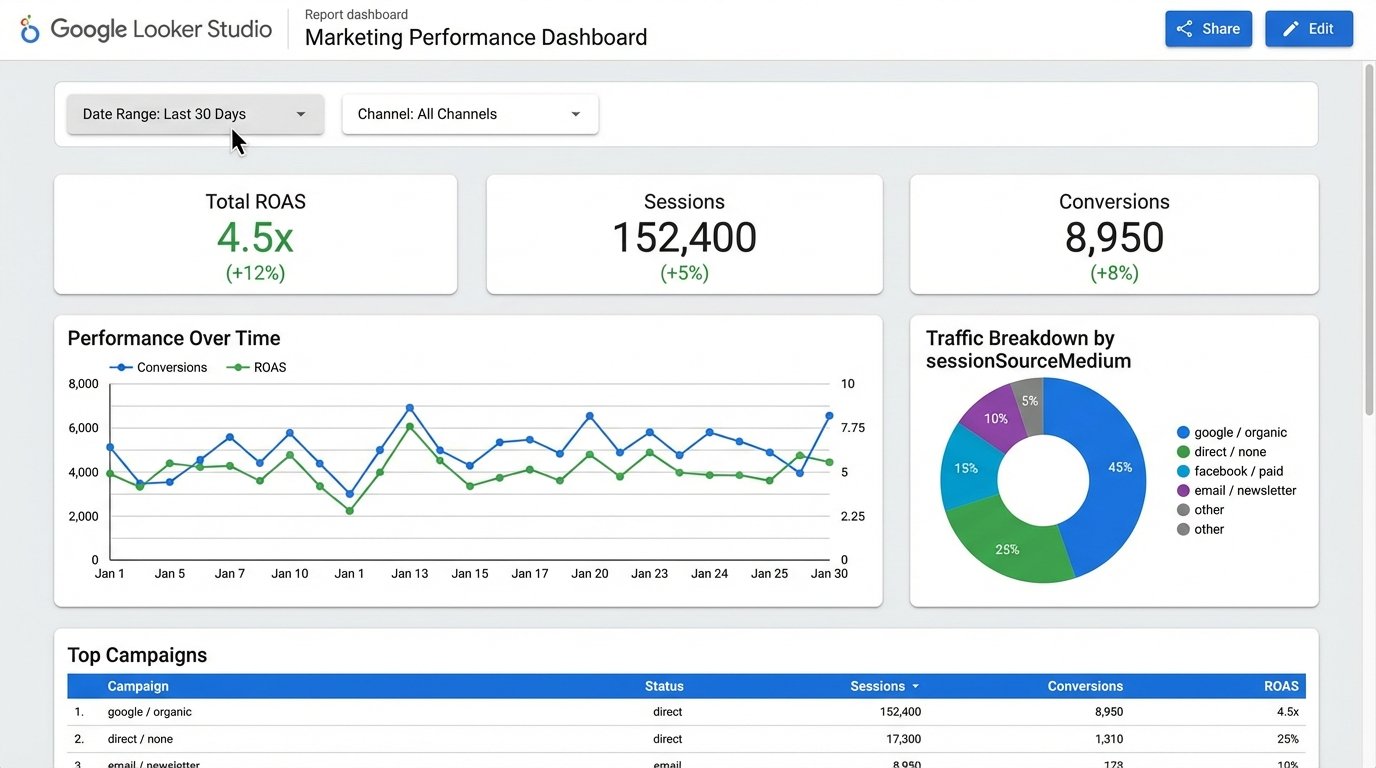
Client satisfaction skyrocketed. Reports were delivered on the first day of the month, every month. The data was presented in interactive Looker Studio dashboards, not stale PDFs. Clients could filter by date and channel themselves, which reduced the number of ad-hoc data pull requests. It transformed the client relationship from a simple report delivery service to a strategic data partnership.
This project was not free. It took about 100 hours of a senior engineer’s time to build and stabilize. The GCP costs are minimal, less than $50 a month for this workload. The agency made its investment back in less than three weeks. More importantly, it created a scalable, durable asset that differentiates them from competitors still stuck in the spreadsheet dark ages.