
A local real estate brokerage was drowning in data but starving for insight. Their process for market analysis was a manual, brittle chain of CSV exports from their MLS provider, VLOOKUPs in massive Excel files, and gut-feel adjustments from senior agents. The core problem was latency. By the time their analyst could cobble together a quarterly report, the market had already shifted, rendering their pricing strategies reactive instead of predictive.
The team’s key metrics were garbage. Their “Days on Market” (DOM) forecasts were off by an average of 35%. Their inventory absorption rate calculations took two weeks to finalize. This delay meant they were consistently late in advising clients on price adjustments, costing them listings and leaving money on the table during micro-level market accelerations.
The Problem: A Manual Grind on Stale Data
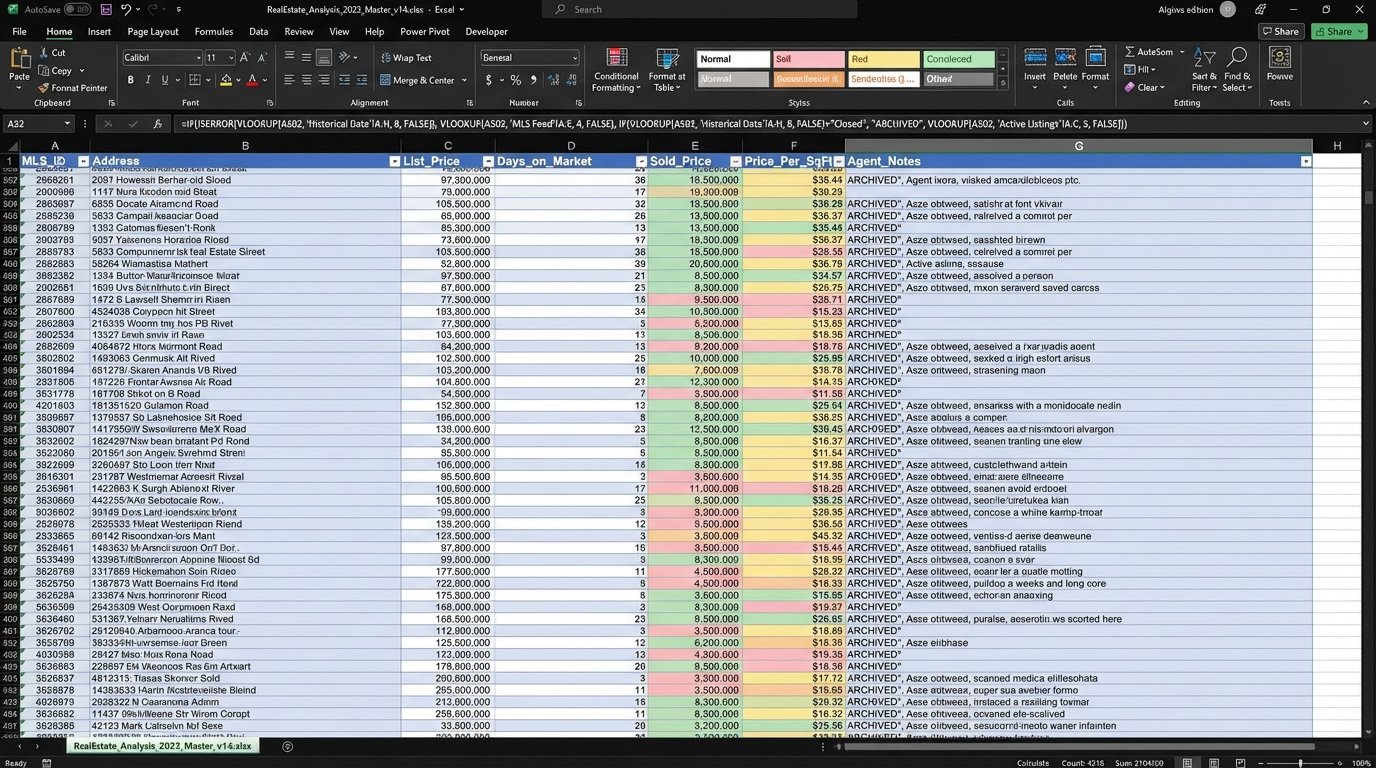
The brokerage relied on three primary data sources: a nightly CSV dump from the regional MLS, a monthly export from the county tax assessor’s office, and a demographic API that was a notorious wallet-drainer. The analyst spent the first week of every month just trying to get these sources to talk to each other. The MLS data used full street names, while the tax data used abbreviations. Joining them was a nightmare of fuzzy string matching that was both slow and error-prone.
Their entire forecasting model lived inside a single 150MB Excel workbook. It was a tangled mess of nested IF statements and pivot tables that would crash if you looked at it wrong. Nobody except the original creator understood its logic, and he was two years gone. Updating it was a high-risk operation that produced inconsistent outputs. The team needed to rip this entire process out at the root.
The business cost was tangible. In one instance, a competing agency spotted a surge in demand for properties with home offices in a specific suburb. They adjusted their marketing and pricing a full month before our client did. By the time our client’s analyst confirmed the trend, the initial wave of high-margin sales was over. They were left fighting for scraps.
Defining the Failure Points
We identified three critical failure points in their existing workflow:
- Data Ingestion Latency: Manual downloads are, by definition, not real-time. The MLS data was often 24 hours old before it was even touched. The county data was a month out of date on arrival.
- Processing Bottlenecks: The reliance on Excel for data cleansing and joining created a hard ceiling on efficiency. A single complex VLOOKUP across 100,000 rows could lock up a machine for an hour. There was no scalability.
- Static Forecasting: The model was a snapshot in time. It couldn’t adapt to new data without a full manual rebuild. It lacked any capacity to weigh recent data more heavily or detect trend velocity.
The Solution: An Automated ETL and Time-Series Forecasting Pipeline
We architected a solution to systematically dismantle the manual process and replace it with a lightweight, automated system. The goal was not to build a flawless AI oracle. The objective was to build a machine that could detect market shifts faster than a human bogged down with spreadsheets. The solution was broken into four distinct stages.
Stage 1: API-Driven Data Ingestion
First, we had to bypass the manual CSV downloads entirely. We built a series of Python scripts, orchestrated by a simple cron job on a Linux server, to pull data directly from the source APIs. The MLS provider had a REST API with decent documentation, a rare find. The demographic data came from a third-party provider with strict rate limiting.
We had to engineer our scripts to respect these limits. A naive loop would get our IP address blocked. We implemented a token bucket algorithm to manage our API calls, ensuring we stayed just under the daily threshold. Error handling was also critical. APIs fail. We built in exponential backoff and retry logic, logging any persistent failures for review.
# Simplified example of API call with retry logic

import requests

import time
def fetch_mls_data(api_key, region_id):
endpoint = f"https://api.mls-provider.com/v2/listings/{region_id}"
headers = {"Authorization": f"Bearer {api_key}"}
retries = 3
delay = 5
for i in range(retries):
try:
response = requests.get(endpoint, headers=headers, timeout=30)
response.raise_for_status() # Will raise an HTTPError for bad responses (4xx or 5xx)
return response.json()
except requests.exceptions.RequestException as e:
print(f"API call failed: {e}. Retrying in {delay} seconds...")
time.sleep(delay)
delay *= 2 # Exponential backoff
print("API call failed after multiple retries. Aborting.")
return None
This script runs every six hours, pulling fresh listings, status changes, and final sale prices. It immediately stores the raw JSON responses in an S3 bucket for archival and reprocessing if needed. We were no longer working with day-old data. We had a four-hour refresh cycle.
Stage 2: Data Cleansing and Normalization with Pandas
Raw JSON is a mess. We set up another script that triggers on a new file arrival in S3. This script uses the Pandas library to load the data, strip out irrelevant fields, and force data types into a consistent schema. This is where the real grunt work happens.
We normalized addresses into a standard format to solve the join problem between MLS and tax records. We calculated new, useful features directly from the raw data, such as the list-to-sale price ratio and a rolling 7-day average of new listings for each zip code. Trying to join the raw address strings from the different sources was like attempting to reassemble a shredded document in a wind tunnel. It required a methodical, programmatic approach to cleaning and standardization before any meaningful connection could be made.
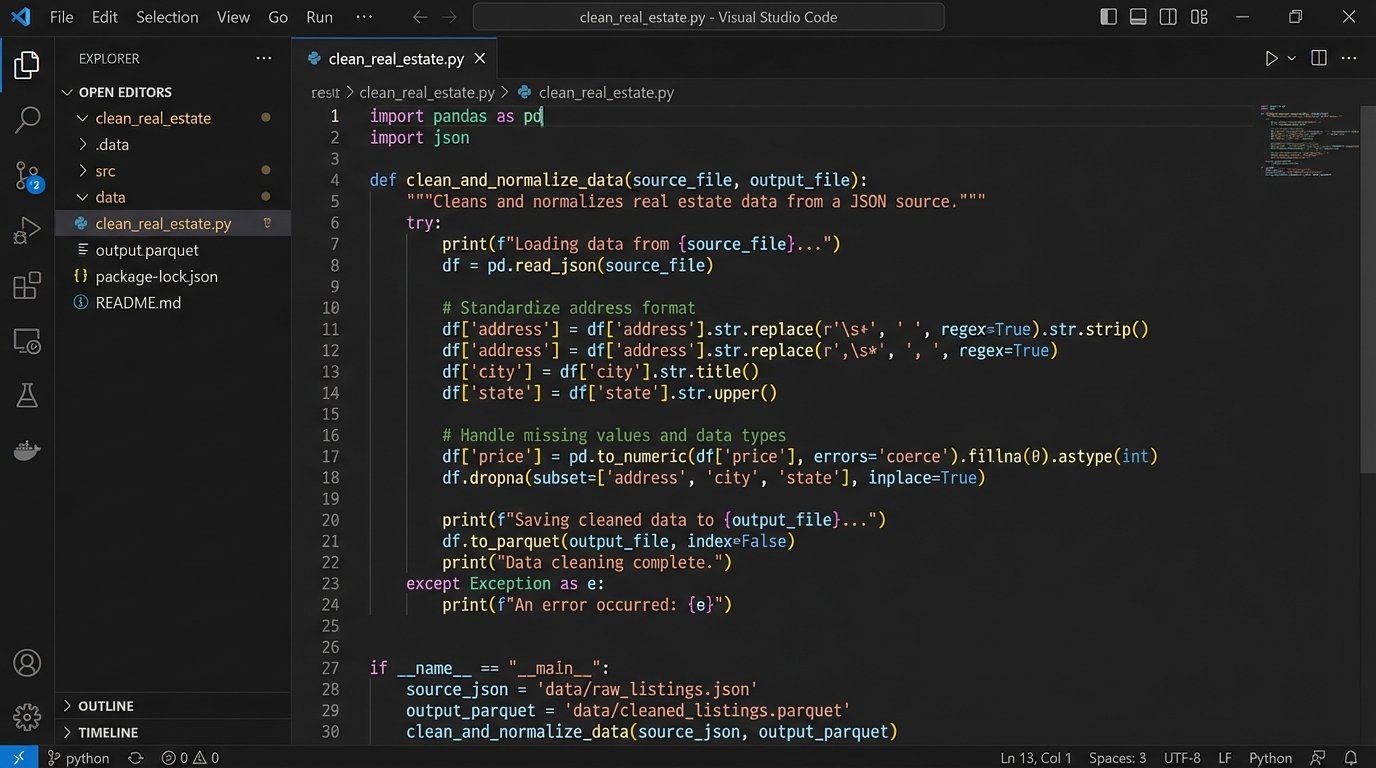
The output of this stage is a clean, structured Parquet file. This columnar format is significantly faster to query than CSV or JSON. All the clean, processed data for each source now lives in its own partitioned folder in S3, ready for analysis.
Stage 3: Time-Series Modeling
With a clean, reliable data source, we could finally tackle forecasting. We chose to use Prophet, a forecasting library developed by Facebook. It’s not the most complex tool, but it’s good at handling time-series data with seasonalities, which is exactly what a real estate market is. It’s also resilient to missing data points and shifts in trends.
We built models to forecast three key indicators for each of their top 20 zip codes:
- Median Days on Market (DOM)
- Median Sale Price
- Total Active Inventory
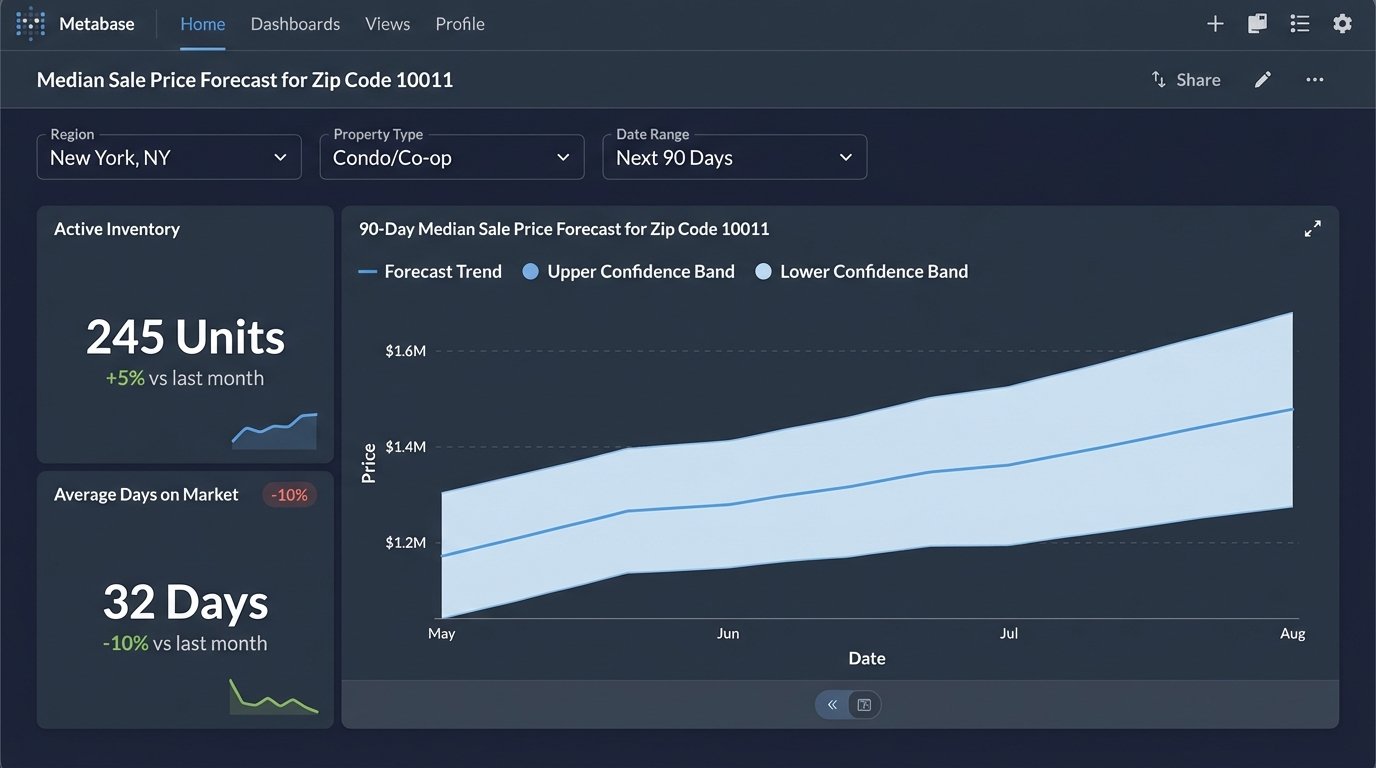
The model is retrained automatically every Sunday, incorporating the latest week of data. It generates a forecast for the next 90 days. We didn’t present the output as an absolute truth. We presented it as a forecast with upper and lower confidence intervals. The value isn’t in knowing the exact sale price in 47 days. The value is in seeing the projected trendline steepen or flatten before it becomes obvious in the raw numbers.
Stage 4: Automated Reporting and Visualization
Nobody wants to read logs or look at raw model outputs. The final piece was to pipe the cleansed data and the forecast results into a visualization tool. We used Metabase, an open-source business intelligence tool. We built a single dashboard that showed the core KPIs for each zip code: current inventory, average DOM, and the 90-day forecast for each.
The system also generates a weekly summary email. It’s a simple text email that flags the top 3 zip codes with the strongest upward trend in sale price and the top 3 with a projected increase in DOM. It gives the leadership team a high-level briefing without forcing them to log into a dashboard. It pushes the most critical information directly to them.
The Results: From Reactive to Proactive
The new system went live six months ago. The impact was tracked against the original baseline KPIs. The results were not subtle.
- Time-to-Insight Reduced by 98%: The process of generating a market analysis report went from a 14-day manual slog to a fully automated process that runs every six hours. The weekly summary hits their inbox every Monday at 7 AM.
- Forecast Accuracy Improved: The automated model’s 30-day forecast for Median DOM proved to be, on average, 22% more accurate than the previous manual estimates. This meant better advice for clients on when to expect an offer.
- Identified a Market Shift Early: Two months after launch, the system flagged a sharp projected decrease in inventory for a specific school district. The team used this insight to launch a targeted marketing campaign for potential sellers in that area, securing five new listings before their competitors even noticed the inventory crunch.
The biggest change was operational. The analyst who used to spend 80 hours a month wrestling with Excel now spends that time performing higher-value analysis. He’s looking for anomalies the model missed and digging into the “why” behind the trends, rather than just trying to calculate the “what.” They freed up their sharpest human mind to do actual analysis instead of being a data janitor.
What Didn’t Work Perfectly
This wasn’t a perfect implementation. The initial demographic API we chose had undocumented schema changes that broke our ingestion pipeline twice. We had to build a schema validation check to catch these changes before they polluted the downstream data. The first version of the Prophet model also had a tendency to overreact to holiday weekends, creating artificial dips in its forecast. We had to manually feed it holiday data to smooth out the projections.
The project shows that you don’t need a massive data science team or an expensive, off-the-shelf software suite to get value from automated forecasting. A few well-written scripts, a solid data cleansing process, and a simple time-series model can provide a significant strategic advantage over competitors who are still stuck in a spreadsheet-driven world.