
Most real estate agents operate on a combination of gut instinct and stale data. They pull a CSV from the MLS, maybe glance at a Zillow page, and call it research. This approach is a systemic failure rooted in a refusal to treat real estate as a data-driven operation. The industry is flooded with overpriced, underpowered CRM software that promises automation but delivers little more than a glorified address book with email templates. The core problem remains untouched: fragmented data sources and a reliance on manual, error-prone report generation.
This isn’t about fancy charts. It’s about operational intelligence. It’s about knowing the absorption rate of a specific subdivision, calculated nightly, not pulled from a quarterly report that was outdated the moment it was printed.
The Manual Grind Is a Technical Debt
The typical workflow is a nightmare of inefficiency. An agent needs a Comparative Market Analysis (CMA). They log into the MLS, apply filters, and export a spreadsheet. They then repeat a similar process on one or two public portals to get off-market data or different valuation models. The result is three different files with inconsistent column headers, address formats, and data types. This data is then manually copied into a master spreadsheet.
Each step introduces latency and a high probability of human error. A typo in a formula, a missed copy-paste, or a misunderstanding of a data field corrupts the entire analysis. This manual process doesn’t scale. Generating ten CMAs for a client looking in multiple neighborhoods is an entire day’s work. This is not a sustainable model for any serious business. It’s technical debt, paid daily in wasted hours and missed opportunities.
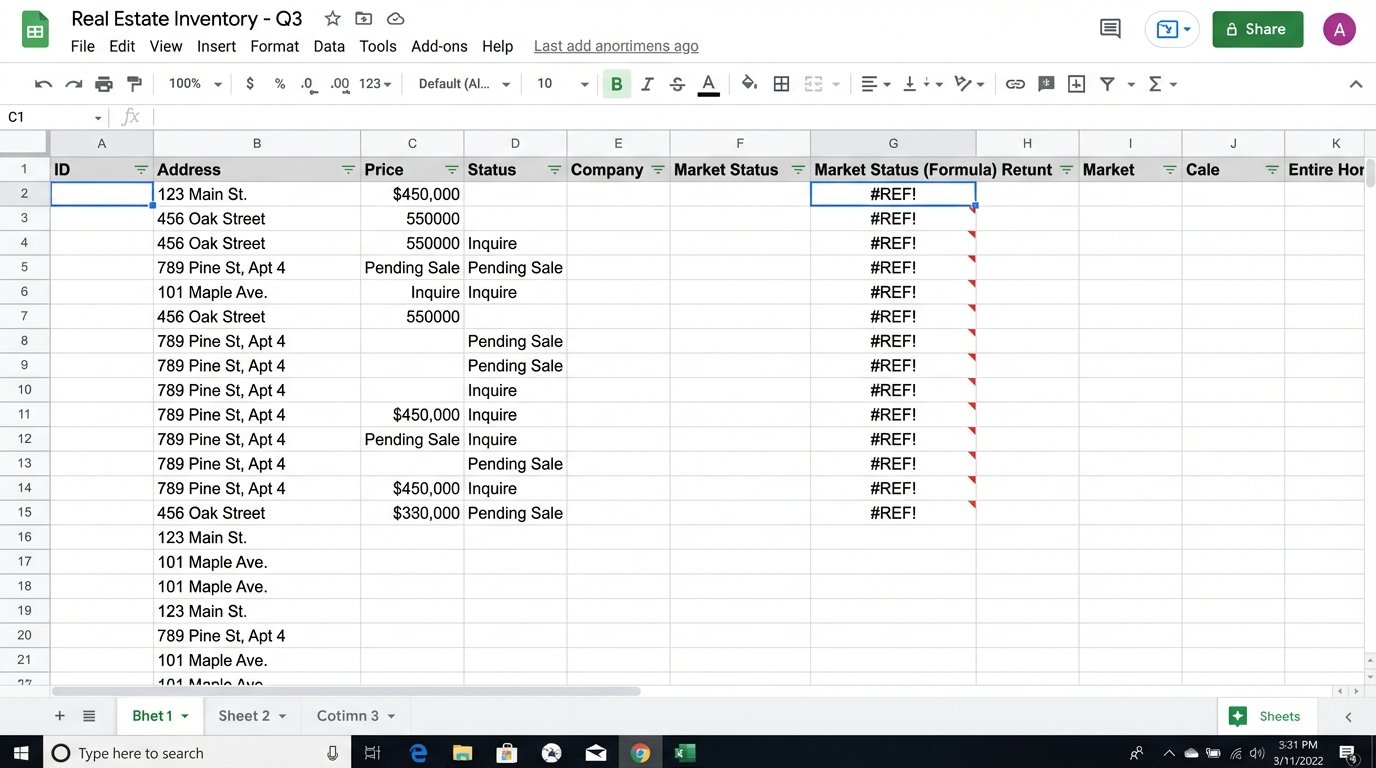
The entire process is brittle. A website changes its HTML layout, and the agent’s manual scraping method breaks. The MLS updates its export format, and the spreadsheet formulas all return `#REF` errors. This constant, low-level maintenance drains cognitive resources that should be spent on negotiation and strategy, not debugging a VLOOKUP function.
Building a Data Aggregation Engine
A sane approach involves creating a centralized data pipeline. This is not a task for an off-the-shelf SaaS product that claims “one-click integration.” It requires a deliberate, engineered solution. The objective is to programmatically pull data from multiple sources, standardize it, store it in a single database, and then build reports on top of that clean, unified dataset.
The core components are an ingestion script, a database, and a reporting front-end. This is the basic stack for any data operation, yet it’s treated like arcane magic in the real estate world. This is not about building a massive, complex application. It’s about writing targeted scripts that solve a specific, high-value problem: data acquisition and normalization.
The Ingestion Layer: APIs and Scraping
Data ingestion starts with identifying your sources. The MLS is the primary target, and many now offer a RETS feed or a Web API. Accessing these is the path of least resistance. You authenticate with a key, make a structured request for new or updated listings in a given area, and receive a predictable JSON or XML response. This is the most reliable method.
A simple Python script using the `requests` library can handle this. You construct the API call, send it, and then parse the response. The goal is to extract the critical fields: address, price, status, days on market, square footage, bed, bath, and MLS ID.
import requests

import json
# Example of a hypothetical MLS API call
API_KEY = 'your_secret_api_key'
HEADERS = {'Authorization': f'Bearer {API_KEY}'}
API_ENDPOINT = 'https://api.local-mls.com/v2/listings'
PARAMS = {
'zip_code': '90210',
'status': 'Active',
'last_updated': '24h'
}
response = requests.get(API_ENDPOINT, headers=HEADERS, params=PARAMS)
if response.status_code == 200:
listings = response.json()
# Logic to process and insert listings into a database follows
print(f"Successfully fetched {len(listings)} new listings.")
else:
print(f"Failed to fetch data. Status code: {response.status_code}")
For sources without an API, like county tax records or smaller local portals, web scraping is the next option. Tools like `BeautifulSoup` or `Scrapy` in Python can be programmed to navigate a website, find the relevant HTML elements, and extract the text. This is a fragile process. A minor site redesign can break your scraper. It requires constant monitoring and maintenance. It’s a cat-and-mouse game you will sometimes lose.
The entire ingestion process should be scheduled to run automatically. A cron job on a simple Linux server can execute these scripts every night. The goal is to have a fresh, comprehensive dataset ready for analysis each morning. This is the engine of the operation. Trying to pull all this data on demand while a client is waiting is like trying to build an airplane mid-flight.
Storage and Normalization: The Central Truth
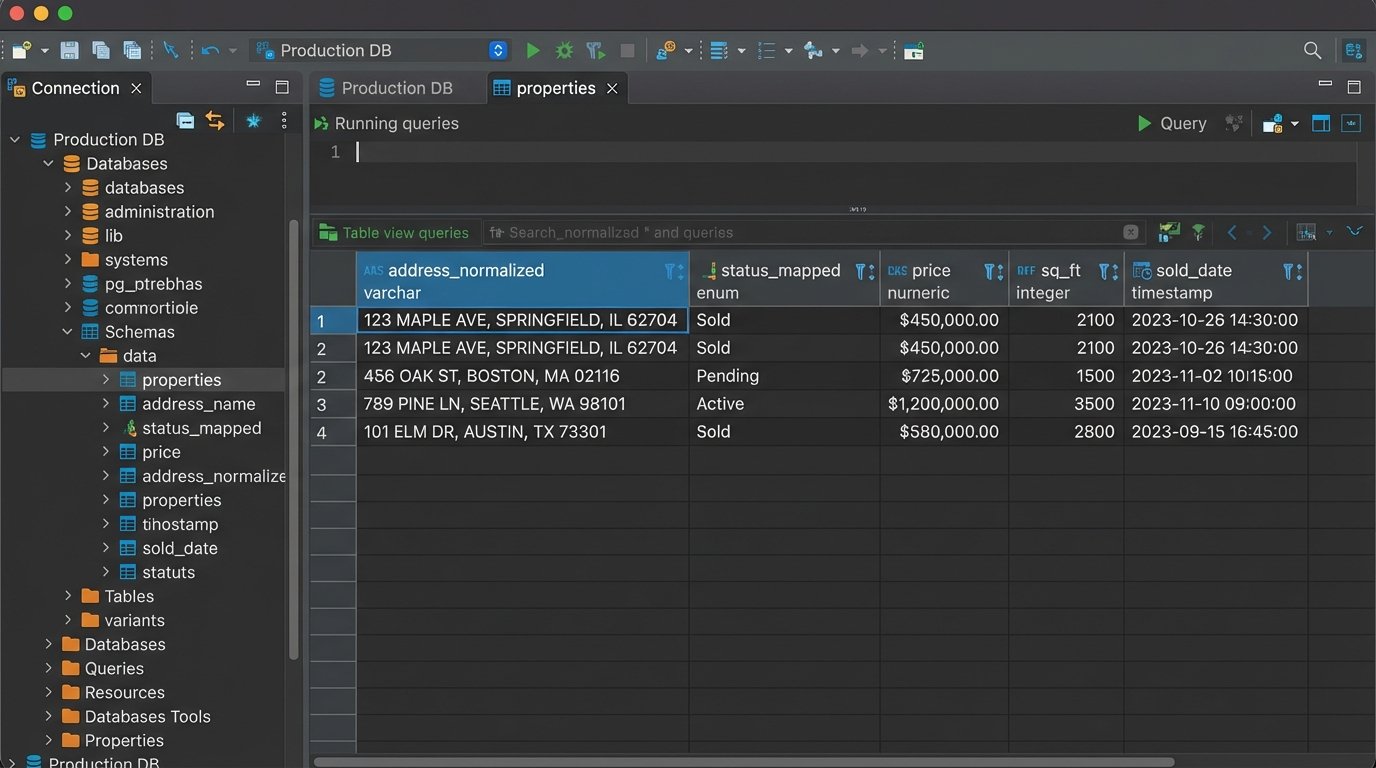
All ingested data must be funneled into a single database. A straightforward PostgreSQL or MySQL instance is more than sufficient. The challenge is not the technology but the data modeling. You need a schema that can accommodate fields from different sources while maintaining a single, coherent structure. This is where data normalization happens.
You will face inconsistencies. One source lists an address as “123 Main St.” while another uses “123 Main Street.” A normalization function is required to standardize addresses before insertion. Another source might list a property as “Active” while another calls it “For Sale.” You need to map these disparate values to a single, internal status. Without this step, your database becomes a junk drawer of conflicting information.
- Address Standardization: Use a library or service to parse and standardize street names, suffixes, and unit numbers.
- Status Mapping: Create a dictionary or mapping table to convert source-specific statuses (e.g., ‘A’, ‘Active’, ‘ForSale’) into a unified set (e.g., ‘ACTIVE’, ‘SOLD’, ‘PENDING’).
- Data Typing: Ensure that prices, square footage, and dates are cast to the correct data types (numeric, integer, timestamp). A price stored as a string with a dollar sign is useless for calculations.
This cleaning process is the unglamorous 80% of the work. It’s tedious, but skipping it renders the entire system worthless. A pristine, reliable database is the foundation for all subsequent analysis.
From Raw Data to Actionable Reports
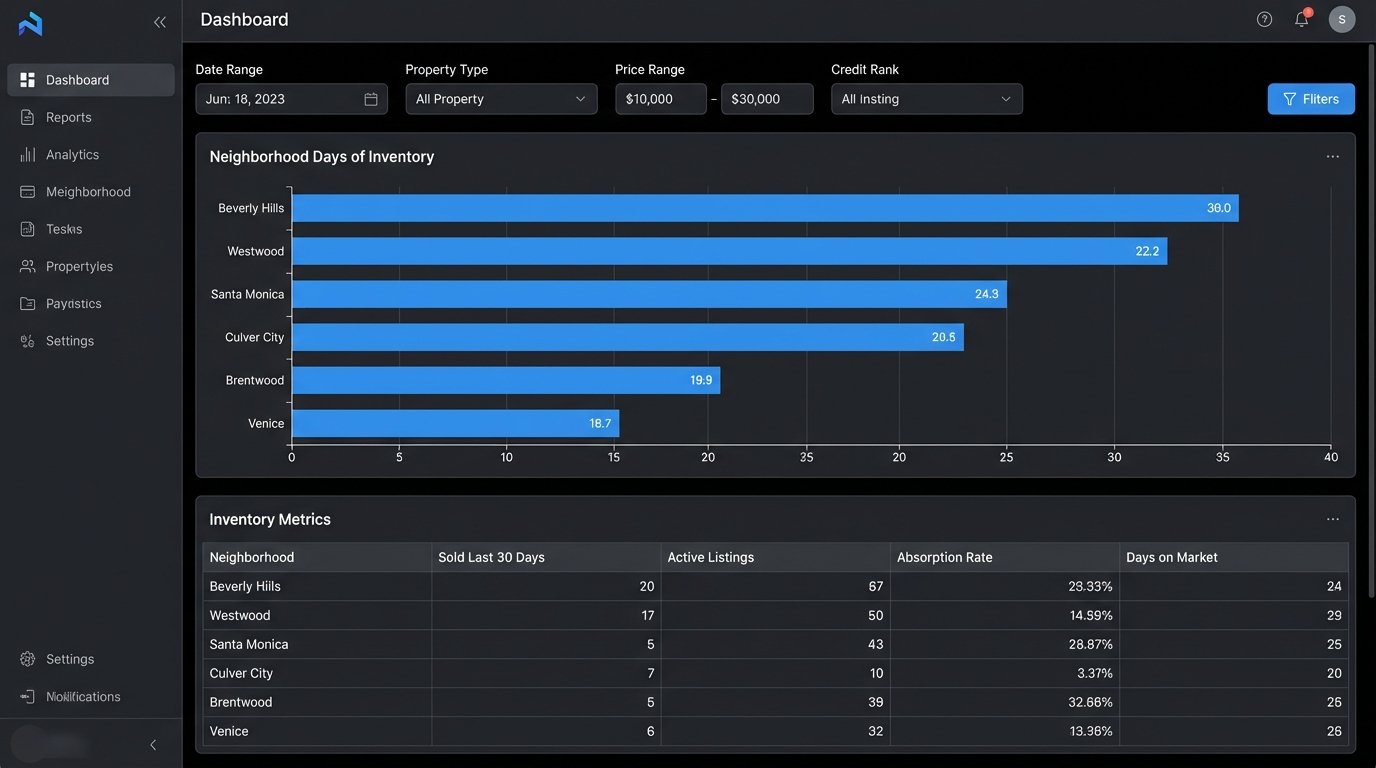
With a clean, centralized database, reporting becomes trivial. You are no longer fighting with spreadsheets. You can connect a business intelligence (BI) tool directly to your database and start building dashboards. Open-source tools like Metabase or Apache Superset are perfectly capable. You can also use something like Google Data Studio if you prefer a managed service.
The reports you can build are now leagues beyond a standard CMA. You can query the data to answer strategic questions that are impossible to address with manual methods.
High-Value Automated Reports
Neighborhood Absorption Rate: Calculate the rate at which homes are sold in a specific polygon-defined area. This requires joining your listings table with a table of geographic boundaries. You can track this metric week over week to spot neighborhoods that are heating up or cooling down before the market does.
SELECT
    neighborhood,
    COUNT(CASE WHEN status = 'SOLD' AND sold_date >= NOW() - INTERVAL '30 days' THEN 1 END) AS sold_last_30_days,
    COUNT(CASE WHEN status = 'ACTIVE' THEN 1 END) AS active_listings,
    (COUNT(CASE WHEN status = 'ACTIVE' THEN 1 END) / NULLIF(COUNT(CASE WHEN status = 'SOLD' AND sold_date >= NOW() - INTERVAL '30 days' THEN 1 END), 0)) * 30 AS days_of_inventory
FROM
    properties
GROUP BY
    neighborhood
ORDER BY
    days_of_inventory ASC;
Price Per Square Foot Deviation: For any active listing, you can instantly calculate the average price per square foot for all comparable properties sold in the last 90 days. This allows you to identify overpriced listings that are likely to sit on the market or underpriced listings that represent a real opportunity. This query runs in milliseconds, not the 30 minutes it takes to build in Excel.
Lead Source ROI: By joining your property data with lead information from your CRM, you can calculate the exact return on investment for different marketing channels. You can determine if leads from a specific online portal close faster or at a higher price point than leads from an open house. This provides hard data to justify marketing spend.
The Unavoidable Friction
This system is not a fire-and-forget solution. It requires technical oversight. API providers will change their endpoints, sometimes with little warning. The websites you scrape will actively try to block your scripts. Rate limiting is a constant concern; you cannot hammer an API with thousands of requests per minute without getting your key revoked. You must build in logic to handle failures gracefully, with retry mechanisms and proper error logging.
The initial build requires a modest investment in development time or hiring a capable engineer. Maintaining the system is an ongoing task. This is the cost of owning your data intelligence instead of renting it from a vendor who gives the same generic reports to all your competitors. The trade is simple: you exchange upfront engineering effort for a durable, long-term competitive advantage based on superior information.