
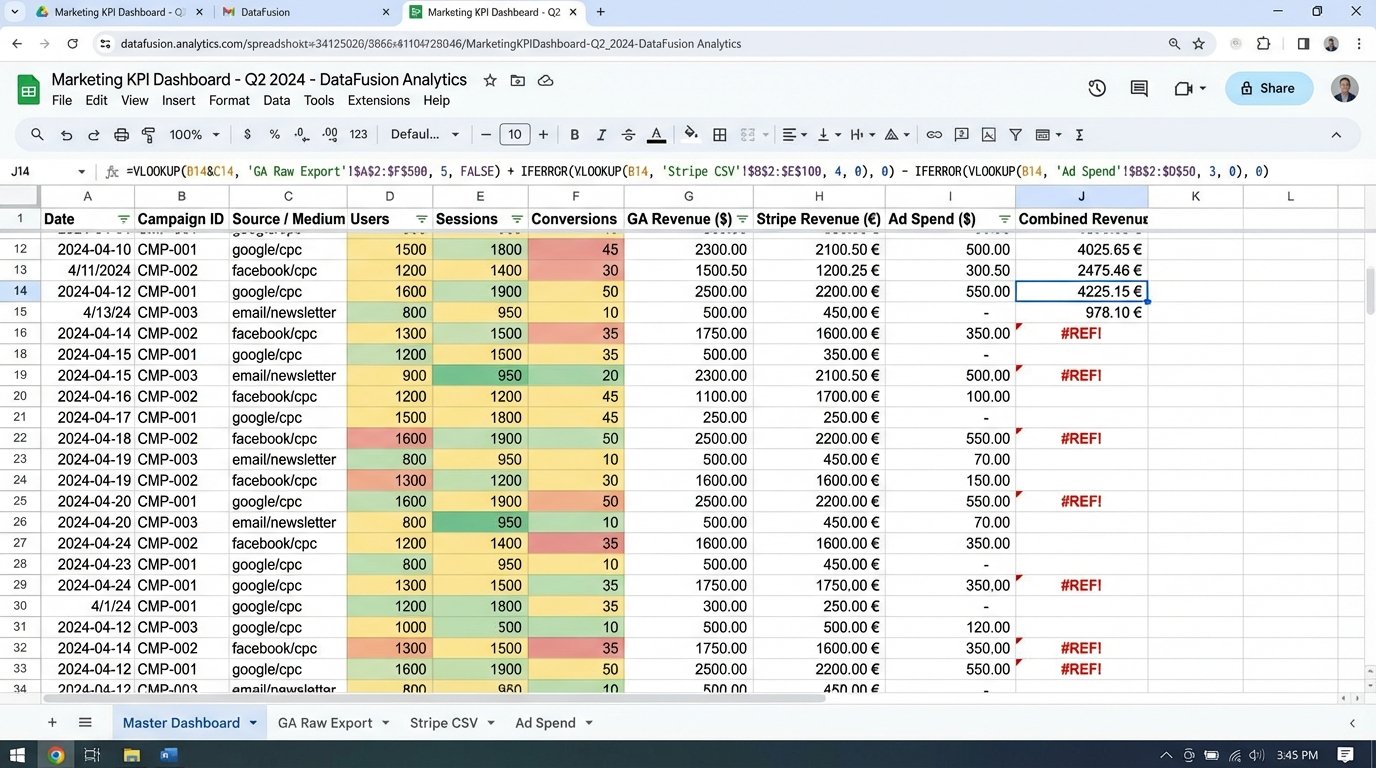
The Spreadsheet is a Liability
Every quarter, someone in marketing exports three CSVs, pastes them into a master spreadsheet, and prays the VLOOKUPs don’t break. This document, full of stale data and hidden formula errors, is then used to make budget decisions. This process isn’t just inefficient; it’s a structural failure waiting to happen. Manual KPI tracking is the technical equivalent of handwriting server logs. It’s an archaic practice that introduces unacceptable levels of risk and latency into the decision-making process.
The core argument is not about saving a junior analyst a few hours a week. It is about building a system of record that is auditable, scalable, and operates at the speed of the business, not at the speed of copy-paste. Optional, manual tracking implies that timely, accurate data is a luxury. It is a foundational requirement.
Deconstructing the Manual Mess
Human error is the most obvious failure point. A misplaced decimal in a revenue column or a dragged formula that corrupts a cell range can go undetected for months. These are not hypothetical problems. They are bugs in the operational logic of a business, created by forcing humans to act as data compilers, a task for which they are poorly suited. The process creates a chain of dependencies on specific people who “own” the magic spreadsheet, making the reporting function fragile.
Data latency creates a bigger problem. A report on last month’s performance delivered on the fifth of this month is a history lesson, not a strategic tool. Market conditions, user behavior, and campaign performance are volatile. Making decisions on week-old data is like driving while looking only in the rearview mirror. You see the crash long after you could have avoided it.
Then there is the fragmentation. The user acquisition cost lives in the ad platform’s API. The customer lifetime value is buried in a Stripe database. The organic session data is in Google Analytics. The manual process requires a person to bridge these disparate systems. This setup is the equivalent of trying to build a car by having different departments mail you one part at a time, with no assembly instructions. It’s a miracle it works at all, and it’s guaranteed to be slow and rickety.
The Scalability Trap
What functions for a single product with two marketing channels completely collapses when the company launches a second product or expands into new regions. The spreadsheet grows, the formulas become a tangled mess, and the time to compile the report balloons from hours to days. At this point, you hire another person to help manage the spreadsheet. You have scaled the problem, not the solution.
This approach actively resists interrogation. Asking a simple follow-up question like “What was the conversion rate for users from paid search on Android last Tuesday?” can trigger a multi-hour fire drill. The data is not structured for queries; it’s structured for a single, static view. True analysis becomes impossible.
The Mandate for an Automated Architecture
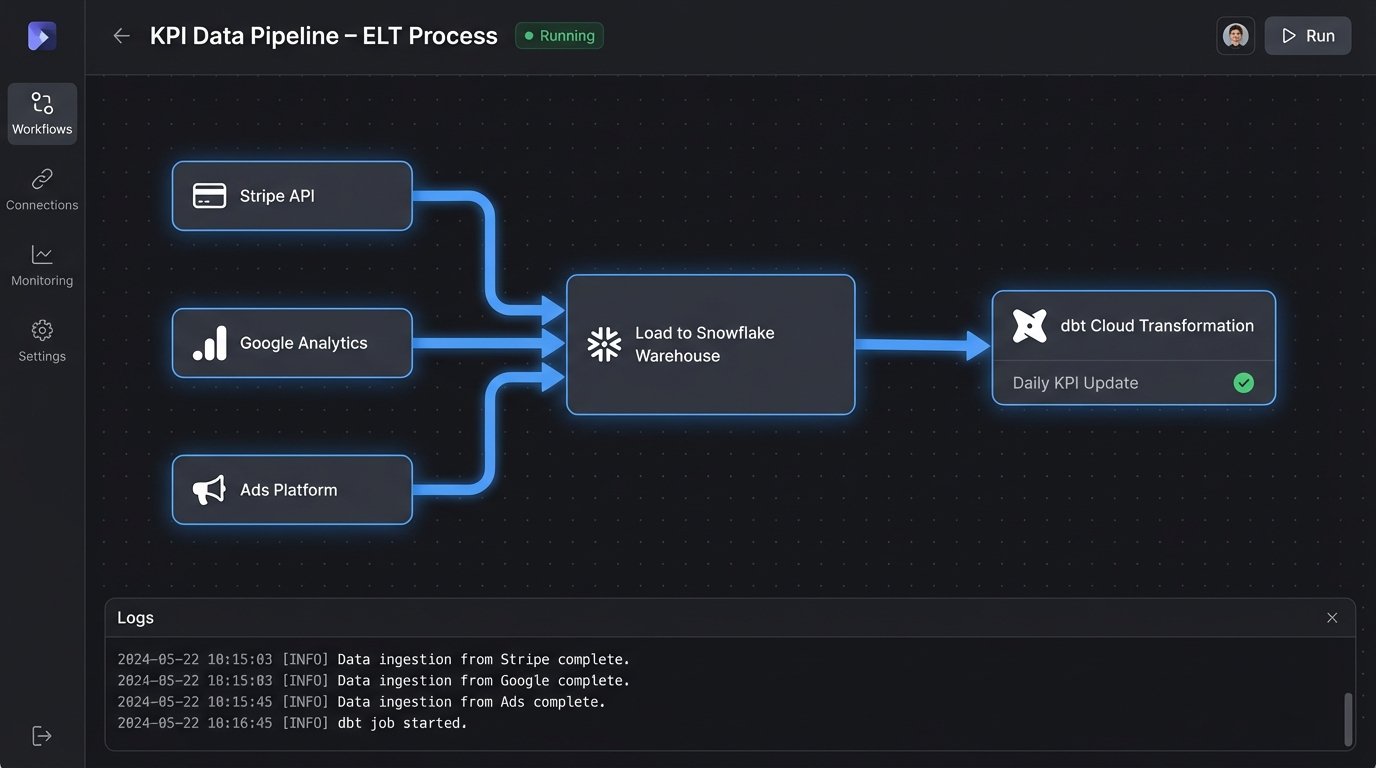
The alternative is to treat KPI reporting as an engineering problem, not an administrative one. The solution is a data pipeline that programmatically extracts data from source systems, loads it into a central repository, transforms it into a usable format, and feeds it into visualization and alerting tools. This is not a project. It is a piece of core infrastructure.
This system provides a single source of truth. When the sales and marketing teams argue about lead quality, they can both query the same, trusted dataset. The definitions for KPIs like “Active User” or “MQL” are not defined in a PowerPoint slide; they are defined in code, in the transformation layer of the pipeline. The definitions are version-controlled, explicit, and auditable.
Building this pipeline is about creating a central nervous system for business metrics. It must automatically collect sensory input from all sources, process it, and fire signals directly to the decision-making parts of the organization. Waiting for a human to write a report is adding a massive, unnecessary delay to the reflex arc.
Core Components of a Real KPI System
The architecture doesn’t have to be a wallet-drainer built on the most expensive enterprise tools. The principles are the same whether you’re using open-source components or managed services. The flow generally follows an ELT (Extract, Load, Transform) pattern, which is more flexible for analytics than traditional ETL.
Data Ingestion: Surviving APIs
The first step is to pull data from the source. This means interacting with dozens of different APIs, each with its own authentication method, rate limits, and pagination logic. Polling an endpoint every hour is a common starting point. A simple Python script running on a cron job or a serverless function can handle this. The key is to build for failure. APIs go down, return corrupted data, or change their schemas without notice.
Your ingestion scripts must have robust error handling, logging, and retry logic. Never assume an API call will succeed. Store the raw, untransformed data in a data lake like an S3 bucket or Google Cloud Storage. This gives you the ability to reprocess the data later if you discover a bug in your transformation logic, without having to re-fetch it from the source API. This raw data store is your safety net.
import requests

import time

import json
# A simplified example, production code needs more robust error handling
def fetch_api_data(api_url, headers, params):
retries = 3
for i in range(retries):
try:
response = requests.get(api_url, headers=headers, params=params, timeout=30)
response.raise_for_status() # Will raise an HTTPError for bad responses (4xx or 5xx)
return response.json()
except requests.exceptions.RequestException as e:
print(f"Attempt {i+1} failed: {e}")
if i < retries - 1:
time.sleep(2 ** i) # Exponential backoff
else:
print("All retries failed. Could not fetch data.")
return None
# --- Usage ---
# api_endpoint = "https://api.example.com/v1/metrics"
# auth_headers = {"Authorization": "Bearer YOUR_API_KEY"}
# query_params = {"start_date": "2023-01-01", "end_date": "2023-01-31"}
# data = fetch_api_data(api_endpoint, auth_headers, query_params)
# if data:
# # Logic to save the raw JSON data to a file or data lake
# with open('raw_data.json', 'w') as f:
# json.dump(data, f)
Cleaning raw JSON output is often like trying to filter sand out of a bucket of water with a fishing net. The structure can be nested, inconsistent, and poorly documented. This is why you load the raw data first, then deal with the mess.
Storage and Transformation
Once the raw data is loaded, you need a data warehouse like BigQuery, Snowflake, or Redshift. These are columnar databases optimized for analytical queries. The "T" in ELT happens here. Using a tool like dbt (Data Build Tool), you write SQL models that clean, join, and aggregate the raw data into useful tables. For example, you might join user data from your internal database with session data from Google Analytics and payment data from Stripe to create a single `dim_users` table.
This transformation layer is where the business logic lives. It's code. It can be tested, version-controlled, and peer-reviewed. This is a radical improvement over formulas hidden in spreadsheet cells.
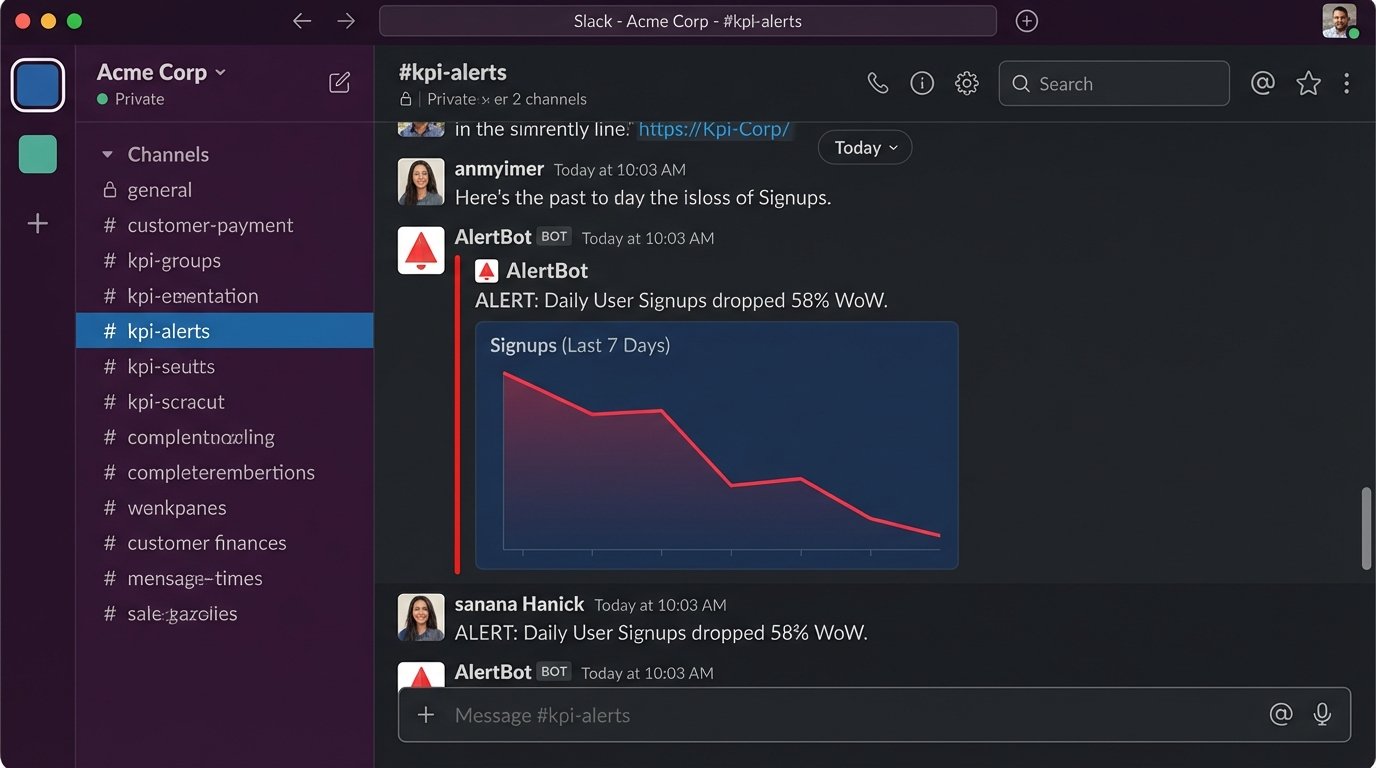
Alerting is Not Optional
A dashboard is a passive tool. Automation's real power comes from active monitoring and alerting. Once your data is clean and structured in the warehouse, you can run queries on a schedule to check the health of your KPIs. If the daily user sign-up count drops more than 50% compared to the previous day's average, the system should automatically fire an alert into a Slack channel. It should not wait for someone to notice the dip on a chart.
These alerts bridge the gap between data and action. They force a response. The system detects the anomaly and notifies the correct people immediately. This shortens the feedback loop from days to minutes.
Confronting the Friction
Implementing this architecture is not a trivial task. The first point of resistance is cost. Cloud warehouse queries, data storage, and the execution of serverless functions all have a price. It requires a budget. Arguing against the cost of this infrastructure is like complaining about the price of fire alarms after your building has already burned down. The cost of a bad decision based on flawed, late data is almost always higher than the cost of the pipeline.
The second point of friction is talent. You need engineers who understand data modeling, API integrations, and cloud infrastructure. A marketing analyst who knows Excel is not the right person to build and maintain this system. This requires a shift in how companies staff their analytics and marketing operations teams, treating data as an engineering discipline.
Vendor lock-in is a valid concern. Building your entire stack on a single cloud provider makes migration difficult. However, using tools like dbt and Terraform can help abstract some of the logic away from the underlying provider, creating a degree of portability. The risk of lock-in is manageable and is a far smaller risk than operating with bad data.
The End Goal: Programmatic Response
The ultimate objective of automated KPI tracking is not just to create prettier dashboards faster. It's to build a foundation for programmatic action. When an automated alert detects a spike in server errors, the next logical step is to trigger a webhook that initiates a partial service rollback. When a key marketing metric plummets, the system could automatically pause the associated ad campaigns to stop wasting money.
This transforms the system from a simple reporting dashboard into an active feedback loop. It stops just telling you the room is on fire and starts automatically adjusting the thermostat. This is where real operational leverage comes from. Manual KPI tracking is a dead end. It doesn't scale, it's brittle, and it keeps your organization perpetually looking backward. Building an automated system is the only way forward.