
Let’s get one thing straight. The term “data-driven realtor” is mostly marketing nonsense. The industry applauds agents for tracking lead sources in a CRM or looking at page views on a Zillow listing. This isn’t being data-driven. It’s reading a dashboard full of vanity metrics designed to keep you paying for the subscription. These are lagging indicators, telling you what already happened, not what will happen next.
The real work is ugly. It involves stitching together disparate public and private data feeds to build a proprietary intelligence engine. It’s about creating an asset that gives you a genuine market edge, not just another report showing you how many people clicked a button last Tuesday.
Your Current Tech Stack Is a Data Silo
Most brokerages operate on a patchwork of disconnected systems. The CRM doesn’t properly talk to the MLS. The marketing automation platform has its own analytics. The website analytics from Google are in yet another silo. Each platform generates its own clean-looking reports, but the data is never forced to confront the data from another system.
This setup actively prevents real insight. You can’t overlay website visitor demographics from Google Analytics with sales cycle data from your CRM without a significant manual export and spreadsheet nightmare. You can’t correlate local building permit trends with your own listing performance. Each system is a locked room, and the vendors like it that way.
The Alternative: Build Your Own Data Pipeline
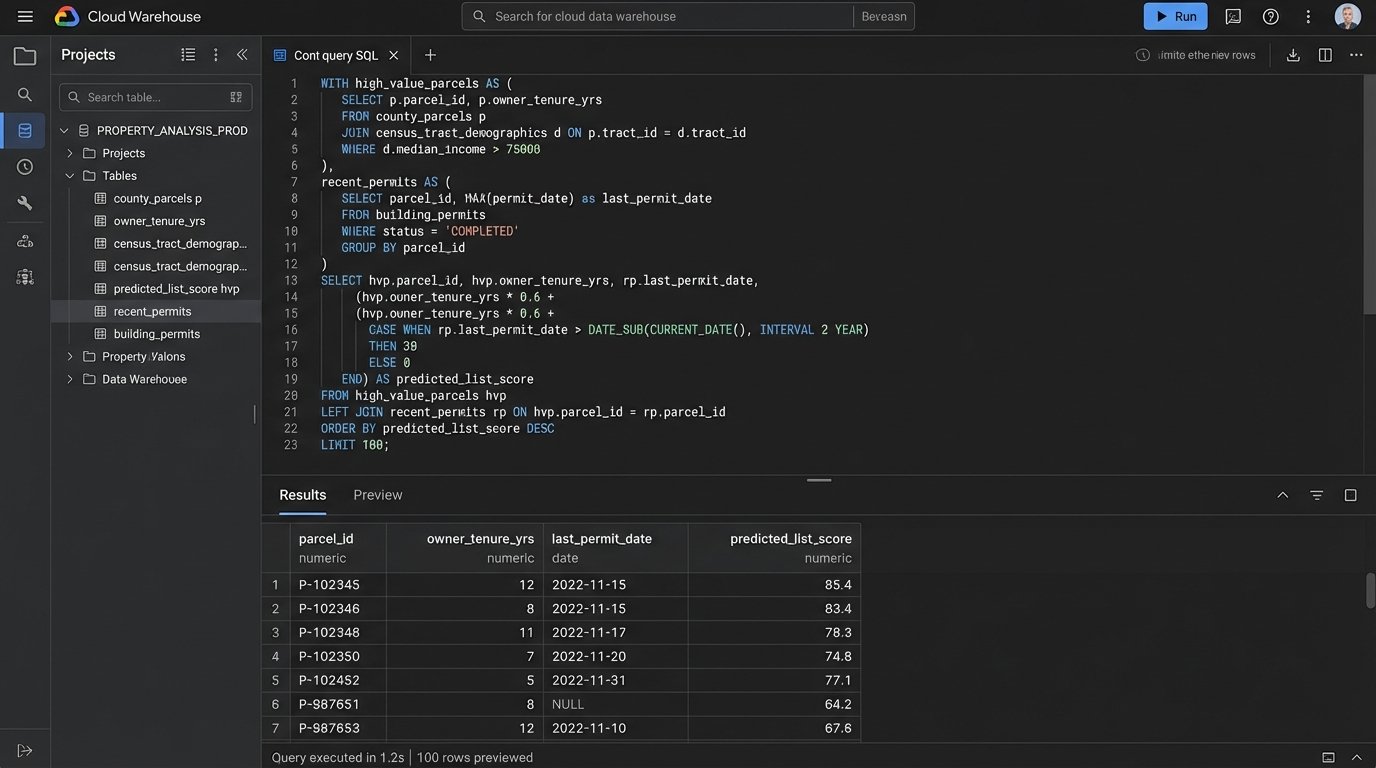
The only durable solution is to bypass the vendor dashboards entirely. You must extract the raw data from these systems via their APIs and centralize it in a single repository that you control. This repository, typically a cloud data warehouse like Google BigQuery or Snowflake, becomes your single source of truth. From there, you can clean, model, and analyze the market in ways your competitors, who are still staring at their CRM charts, cannot.
This approach moves you from reacting to historical reports to building predictive models. The goal is to ask questions your off-the-shelf software can’t answer. Questions like, “Which properties in this zip code have the highest probability of listing in the next six months based on ownership tenure, lack of recent permits, and rising tax assessments?” Zillow won’t tell you that.
Step 1: Data Extraction via API
The first task is to pull data. This means writing scripts to systematically hit the APIs of every data source you can get your hands on. Public records from the county assessor, building permits from the city, school performance data, MLS historicals, and even your own internal CRM data. You need to become a data hoarder.
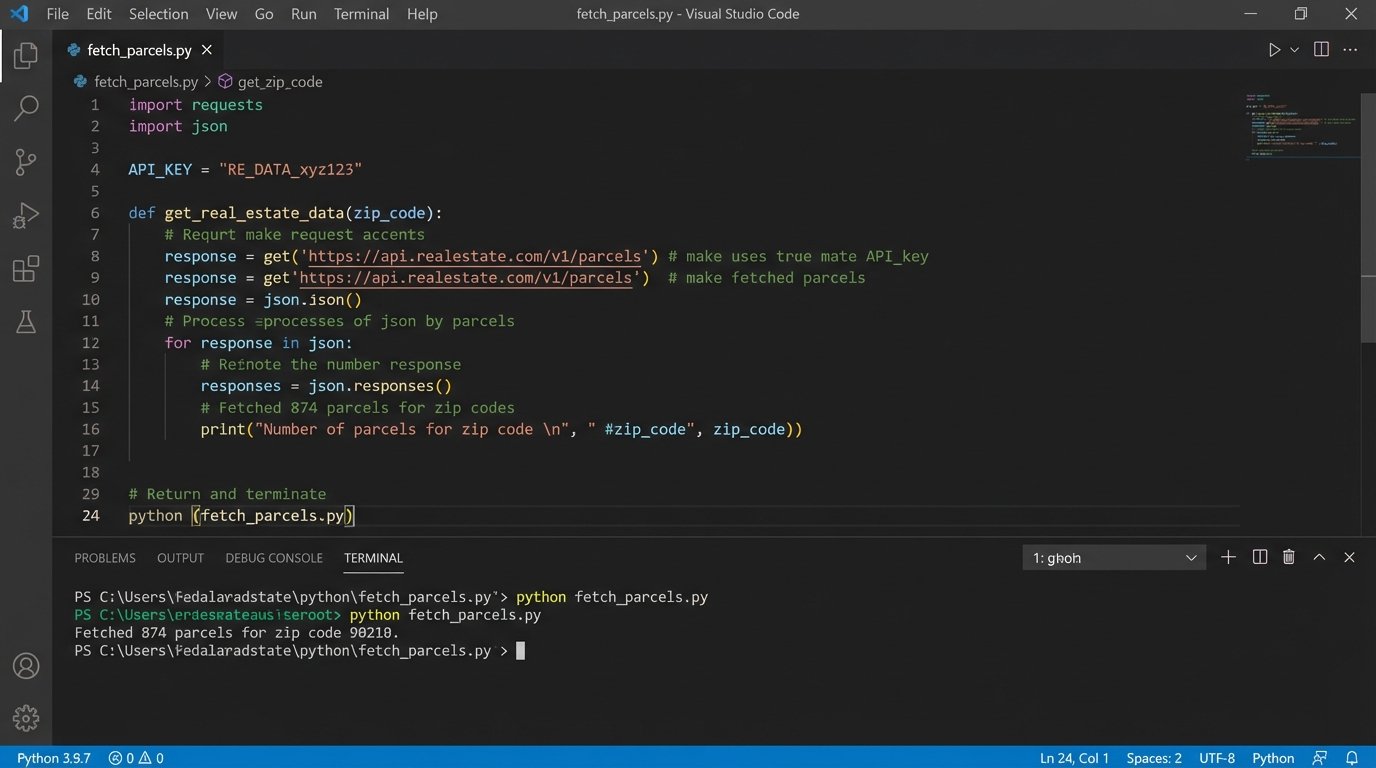
Your scripts, likely written in Python using the `requests` library, will handle the authentication, pagination, and rate limiting for each API. The raw output, usually JSON, gets dumped into a cloud storage bucket. The process is not a one-time event. These jobs must be scheduled to run periodically to keep your data current.
import requests

import json

import os
# Example of a simplified API call to a hypothetical county tax assessor API
API_KEY = os.environ.get("COUNTY_API_KEY")
BASE_URL = "https://api.county.gov/v1/parcels"
HEADERS = {"Authorization": f"Bearer {API_KEY}"}
def fetch_parcel_data(zip_code):
params = {
"zip": zip_code,
"page": 1,
"per_page": 100
}
all_parcels = []
while True:
response = requests.get(BASE_URL, headers=HEADERS, params=params)
# Basic error checking
if response.status_code != 200:
print(f"Error: Received status code {response.status_code}")
break
data = response.json()
parcels = data.get("parcels", [])
if not parcels:
break # Exit loop if no more parcels are returned
all_parcels.extend(parcels)
params["page"] += 1
# In a real pipeline, you would save this to a file or stream it to storage
with open(f"parcels_{zip_code}.json", "w") as f:
json.dump(all_parcels, f)
print(f"Fetched {len(all_parcels)} parcels for zip code {zip_code}.")
# Run the function for a target area
fetch_parcel_data("90210")
This code is deceptively simple. The reality involves robust error handling, retry logic for when an API inevitably fails at 3 AM, and managing credentials securely. Every API has its own quirks and undocumented “features.”
Step 2: Centralize and Transform the Mess
Once you have the raw data, you load it into your data warehouse. This is the easy part. The hard part is transformation. Public data is notoriously dirty. The same address will be formatted ten different ways across ten different systems. You will spend more time cleaning and standardizing data than you will on actual analysis. This is the unglamorous core of the work.
We use SQL-based tools like dbt to execute these transformations. A typical task is joining property data from the county assessor with listing data from the MLS using a parcel ID number as the common key. This single join creates a dataset that is more valuable than the sum of its parts. Suddenly, you can see tax history alongside listing history for every property.
Trying to model this data correctly is like shoving a firehose through a needle. The inputs are massive and malformed, but the output needs to be a precise, structured table that a business intelligence tool can actually use. Get the logic wrong, and your entire analysis is garbage.
Moving from Reporting to Intelligence
With a clean, centralized dataset, the nature of your questions changes. You stop asking “What was our sales volume last quarter?” and start asking “What are the shared characteristics of homes that sold 20% over asking price in the last 90 days?” The first is reporting. The second is intelligence.
Your BI tool, whether it’s Looker Studio, Tableau, or Power BI, now connects to your data warehouse. You are no longer constrained by the pre-built widgets of a SaaS dashboard. You can build any visualization you want. You can map out every property that hasn’t pulled a construction permit in 15 years, color-coded by the owner’s tenure. That’s a target list for potential sellers.
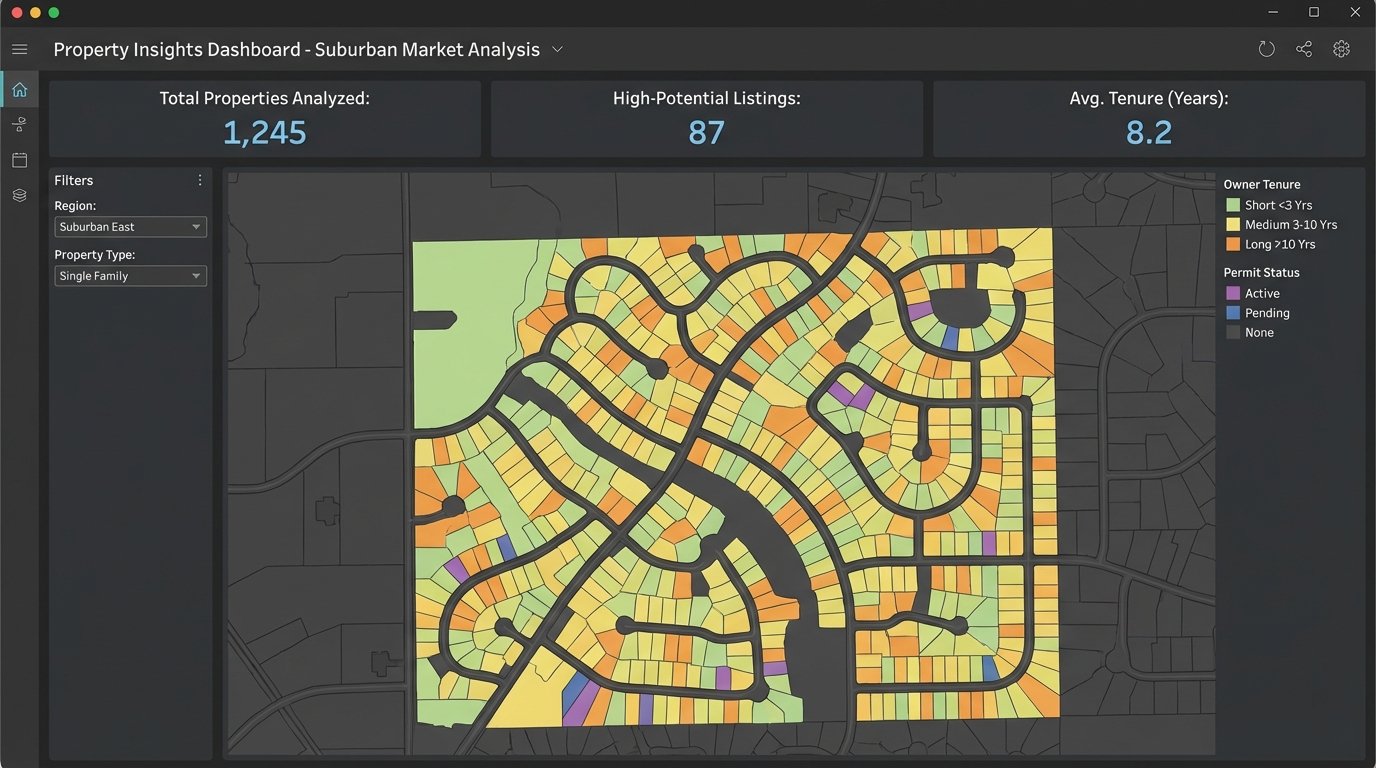
You can segment your market with a precision that is impossible otherwise. Create a report of all single-family homes in a top-rated school district with an assessed value below the neighborhood median. This identifies potential renovation opportunities or undervalued assets. This is how you find deals before they hit the market.
The Inevitable Trade-Offs
This approach is not for everyone. It requires a specific skill set that most real estate brokerages lack. You need someone who can write code, manage cloud infrastructure, and model data. This is not a task for the marketing intern.
The cost is also a factor. API access fees, cloud storage, and data warehouse compute costs can add up. This is a wallet-drainer for a small operation. It’s an investment in a long-term strategic asset, not a quick fix to generate leads. You are building infrastructure, not running a campaign.
- High Initial Cost: Expect to pay for engineering talent, API subscriptions, and cloud services.
- Maintenance Overhead: Data pipelines are brittle. APIs change without warning, data schemas get updated, and code breaks. This system requires constant monitoring.
- Data Quality Issues: Public data sources are often inaccurate or out of date. You will spend a significant amount of time developing logic to clean the data and handle inconsistencies.
The Unfair Advantage
Building this system is a painful, expensive process. That is precisely why it creates a competitive moat. While your competitors are refreshing their Zillow Premier Agent dashboard, you are querying a proprietary dataset that maps demographic shifts against property lifecycle triggers. You’re not just buying leads. You’re predicting inventory.
The brokerage of the future looks less like a sales floor and more like a quantitative hedge fund. It runs on a centralized data asset that is constantly enriched with new sources. The top agents won’t be the ones with the best sales script, but the ones who can best query this system to find opportunity.
Stop thinking about “data-driven” as reading reports. Start thinking about it as building a machine to systematically identify and exploit market inefficiencies. The tools are available. The only barrier is the will to abandon the comfort of vendor dashboards and do the hard work of building a real asset.