
Your lead generation from Zillow dropped 30% yesterday. Your team found out this morning by manually pulling a report. The data sat there for 18 hours, a quiet failure losing money while everyone assumed the pipeline was healthy. This isn’t a hypothetical. This is the direct result of relying on dashboards instead of building triggers. Dashboards are passive. They require a human to find the problem. An automated alert system forces the problem into view.
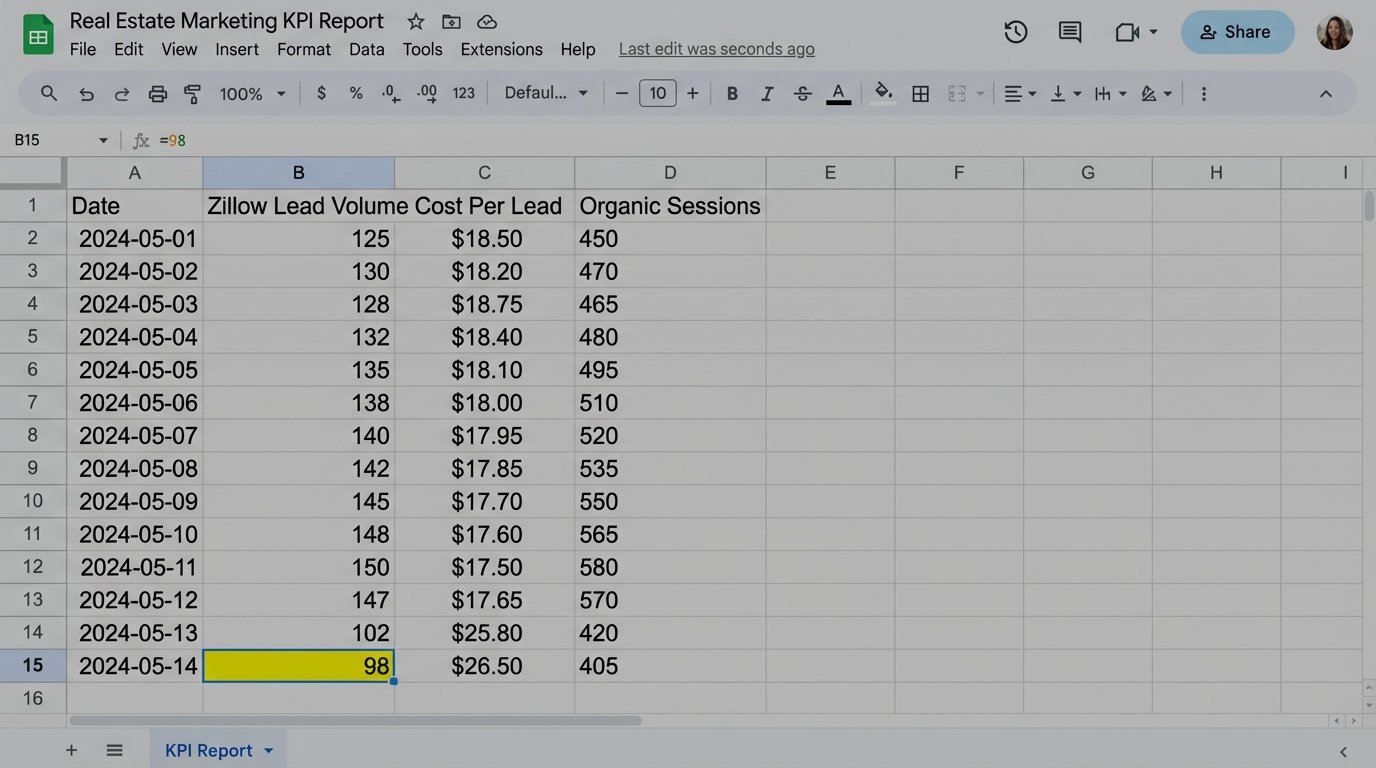
The standard operating procedure is a junior analyst exporting CSVs into a spreadsheet every morning. They check lead volume, cost per lead, organic sessions to key listing pages, and maybe bounce rates. The process is a fragile, single point of failure. The analyst gets sick, goes on vacation, or gets pulled into a fire-drill meeting. The check doesn’t happen. The blind spot persists.
The Failure of Manual Oversight
Manual KPI tracking is fundamentally broken for any digital real estate operation. The market moves too fast. A new featured listing page can see its traffic evaporate overnight due to a botched canonical tag update. A pricing API feeding your mortgage calculator can start failing, killing conversion rates on high-intent pages. Waiting until the next day’s 9 AM meeting to spot these issues is operational negligence.
Spreadsheet-based analysis is the illusion of control. It creates a clean, historical record of failure long after the window for an effective response has closed. It documents the damage instead of preventing it. The core issue is latency between the event and the detection. Every minute that latency exists, you are bleeding leads, budget, or rankings.
The Hidden Costs of Human Latency
We focus on the obvious metric drops, but the secondary costs are more corrosive. Engineers and marketers lose trust in the data because it’s always stale. When a report finally shows a problem, the first hour is spent validating if the data is even correct, because manual exports are prone to filter errors or date range mistakes. This cycle of distrust and validation burns expensive hours that should be spent fixing the actual root cause.
The other cost is opportunity. When a new campaign over-performs, you want to double down on its budget immediately, not 24 hours later. When a competitor’s site goes down, you want to push bids on shared keywords instantly. Manual reporting ensures you are always reacting to yesterday’s reality, never capitalizing on the present moment.
Architecting a Proactive Alerting System
A real solution is not a better spreadsheet template. It’s a decoupled system with three distinct parts: a data ingestion layer, a logic core for threshold checking, and an alert dispatch mechanism. The goal is to remove the human from the repetitive task of checking and reposition them as the recipient of a high-signal, actionable notification.
Step 1: Data Ingestion and Normalization
First, you need direct API access to your data sources. Stop using CSV exports. This means hitting the Google Analytics Data API for traffic and engagement, your CRM API (like Salesforce or HubSpot) for lead and MQL counts, and the Google Ads API for spend and conversion data. For each source, you build a simple client that authenticates, runs a predefined query, and pulls the raw numbers.
The key here is normalization. A “lead” from your CRM and a “conversion” from Google Ads need to be mapped to a single, unambiguous metric within your system. You strip the source-specific naming conventions and create a clean, internal data structure. This is where most junior-led projects fail. They pipe inconsistent data formats directly into their logic, creating a brittle mess that breaks with the smallest API change.
Step 2: The Logic Core and Threshold Definition
Once you have clean data, you need a machine to check it. The logic core is where the actual intelligence of the system resides. It fetches the latest data point for a given KPI and compares it against a defined threshold. There are several ways to build this, each with its own baggage.
The Lightweight Script (Google Apps Script)
For a single, critical KPI, a simple script running on a schedule is the fastest path. Google Apps Script is a solid choice because it lives inside the Google ecosystem, making it trivial to pull from Google Analytics, write to a Google Sheet for logging, and send an email via Gmail. You can set it on a time-based trigger to run every hour.
This approach is cheap and direct. The downside is scalability. Managing 20 different scripts for 20 KPIs is a maintenance nightmare. Error handling is rudimentary, and they can be fragile if the underlying data structure changes. It’s a scalpel, not a surgical suite.
Here is a conceptual example of what a function inside a Google Apps Script might look like. This is not production code. It’s a structural illustration to show the core components: fetch, compare, and alert.
function checkLeadVolumeThreshold() {

  const SPREADSHEET_ID = 'YOUR_LOGGING_SPREADSHEET_ID';

  const SHEET_NAME = 'KPI_LOG';

  const ALERT_EMAIL = 'stakeholder@yourcompany.com';
// Define the threshold. A real system would make this dynamic.
const CRITICAL_THRESHOLD = 50; // Alert if hourly leads drop below 50.
try {
// 1. Fetch data from the source (e.g., a CRM API wrapper function)
const currentLeadCount = getHourlyLeadsFromCRM();
// 2. Log the check for historical tracking
const sheet = SpreadsheetApp.openById(SPREADSHEET_ID).getSheetByName(SHEET_NAME);
const timestamp = new Date();
sheet.appendRow([timestamp, 'Lead Volume', currentLeadCount]);
// 3. Compare against the threshold
if (currentLeadCount < CRITICAL_THRESHOLD) {
const subject = 'CRITICAL ALERT: Hourly Lead Volume Below Threshold';
const body = `Hourly lead volume has dropped to ${currentLeadCount}, which is below the critical threshold of ${CRITICAL_THRESHOLD}.` +
`\n\nPlease investigate immediately.` +
`\n\nChecked at: ${timestamp.toString()}`;
// 4. Dispatch the alert
MailApp.sendEmail(ALERT_EMAIL, subject, body);
}
} catch (e) {
// Basic error handling: alert an engineer that the script itself failed.
const errorSubject = 'ALERT SCRIPT FAILURE: Lead Volume Check Failed';
const errorBody = 'The checkLeadVolumeThreshold() script failed to execute. Error: ' + e.toString();
MailApp.sendEmail('dev-alerts@yourcompany.com', errorSubject, errorBody);
}
}
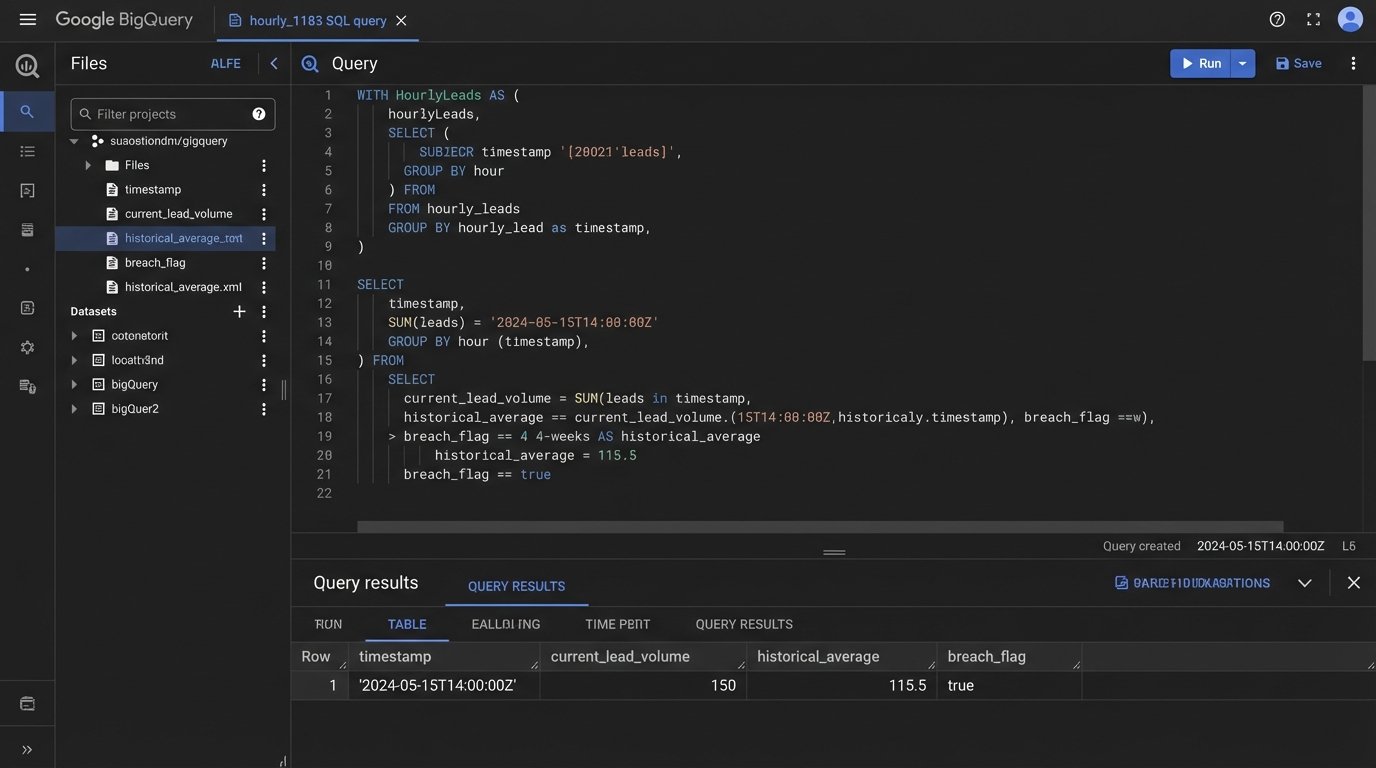
The Data Warehouse Approach (BigQuery)
A more robust solution involves piping all your raw data into a data warehouse like Google BigQuery. Tools like Fivetran or Stitch can automate this data ingestion. Once the data is centralized, you write SQL queries that run on a schedule. The query itself contains the threshold logic, comparing today's value to a historical average or a fixed number. If the query returns a result (meaning a threshold was breached), it can trigger a downstream action via Cloud Functions, which then sends the alert.
This architecture is superior because it decouples the components. Your alerting logic is just SQL, separate from the data ingestion pipelines. It scales beautifully. Adding a new KPI alert is as simple as writing a new SQL query. The primary disadvantage is cost and complexity. You're now managing a data warehouse, ETL pipelines, and a cloud function. It's a wallet-drainer if you don't have the scale to justify it.
Step 3: Intelligent Alert Dispatch
Email is noisy. A critical alert for a 50% drop in organic traffic shouldn't land in the same inbox as a marketing newsletter. The final piece of the system is routing the alert to the right channel with the right level of urgency. For high-severity events, use a webhook to post a message directly to a dedicated Slack or Microsoft Teams channel for the relevant team (e.g., #seo-alerts, #paid-media-ops).
The alert message must be structured for action. It should contain three things:
- What broke: "Organic sessions to /new-york-condos/ are down 40% WoW."
- The exact numbers: "Last hour: 60 sessions. Same hour last week: 100 sessions."
- A direct link to investigate: A link to the Google Analytics report or the relevant dashboard.
This removes the need for the recipient to go hunting for the problem. The alert provides the signal and the starting point for diagnosis.
The Inescapable Problems You Will Face
Building this system is not a clean, linear process. You will hit walls. The primary challenge is defining a "good" threshold. A static number is useless in a business with seasonality. A 20% drop in leads on a Saturday might be normal, but on a Tuesday it's a catastrophe. Your logic needs to be smarter than a simple `if x < y`.
Defining "Normal" Is a Black Art
The most effective thresholds are dynamic. You should be comparing the metric to a rolling average, like the same hour yesterday or the average for that hour over the previous four weeks. This logic-checks the metric against its own established pattern, automatically accounting for daily and weekly fluctuations. Setting this up requires you to store enough historical data to build a reliable baseline. This is where a simple script falls apart and a data warehouse becomes necessary.
It feels like trying to engineer a submarine while it's already underwater. You are building rules based on a system that is live and constantly shifting. You will have to tune your thresholds constantly for the first few months to filter out the noise and find the true signal for a critical failure.
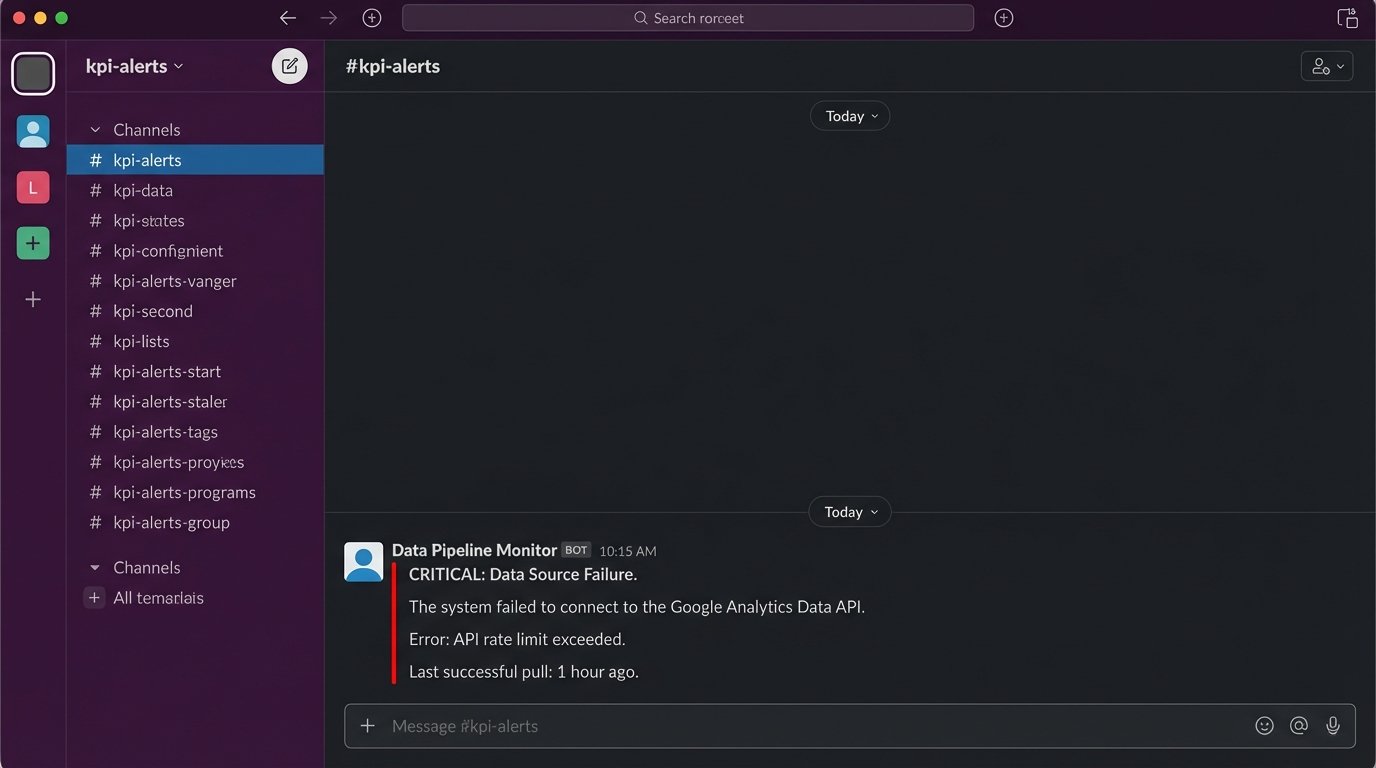
API Dependencies Are Brittle
Your beautiful automation is entirely dependent on third-party APIs. Google can deprecate an API version, your CRM provider can change an authentication method, or a rate limit can be hit during a high-volume period. Your system needs robust error handling that specifically alerts you when the data source itself is unreachable or returning garbage. An alert that says "Could not connect to GA4 API" is just as important as an alert about a KPI drop.
Fighting Alert Fatigue
If you send too many alerts, they all become noise. Your system will be ignored into irrelevance. Start with one or two truly critical, revenue-impacting KPIs. Set the thresholds conservatively at first, aiming only for major deviations. A system that sends one high-impact alert a week is far more valuable than one that sends 20 low-confidence notifications a day.
The goal is not to monitor everything. The goal is to create an automated, unavoidable signal for the events that demand immediate human intervention. Stop passively watching dashboards and build a system that forces your team to act.