
Analytics & Reporting Automation
Your Google Ads account reports 500 conversions. Your analytics platform shows 420. The CRM claims only 80 qualified leads came from those campaigns. This isn’t an anomaly. It’s the default state of digital marketing analytics, where every platform operates in its own locked room, showing you a distorted reflection of reality. The standard fix involves dumping CSVs into a spreadsheet and burning hours on VLOOKUPs, a process so brittle it breaks if someone adds a space to a campaign name.
This approach is a dead end. It doesn’t scale, it’s saturated with human error, and the resulting report is obsolete the moment you export the data. The real problem isn’t the dashboards. It’s the fractured data foundation underneath them. To get a clear picture, you have to stop fetching reports and start syncing raw data. The goal is to build a single, unified data repository that acts as the source of truth, forcing all your disparate systems to conform to one logical model.
The Architectural Blueprint: A Central Data Warehouse
Forget platform-specific reporting. The solution is to establish a central data warehouse, a place where raw data from all sources is ingested, cleaned, and modeled for analysis. We’re talking about tools like Google BigQuery, Snowflake, or Amazon Redshift. This warehouse becomes the canonical source for all business intelligence. The pipeline logic is straightforward: extract data via APIs, load it raw into a staging area, transform it into a unified model, and then push it to final reporting tables that power your dashboards.
This architecture decouples data collection from reporting, which means a change in a dashboard doesn’t require a new data pull. It means you can ask complex, cross-platform questions that are impossible to answer from within a single tool’s UI.
Phase 1: Extraction. The API Battle.
Getting data out of source platforms is the first hurdle. Every API is a unique beast with its own authentication quirks, rate limits, and documentation that was likely outdated six months ago. Your first job is to logic-check the feasibility of extracting the specific fields you need. Don’t assume the “Conversions” metric in the UI is available as a clean integer via the API. It might be buried in a nested JSON object or require a separate, asynchronous report request.
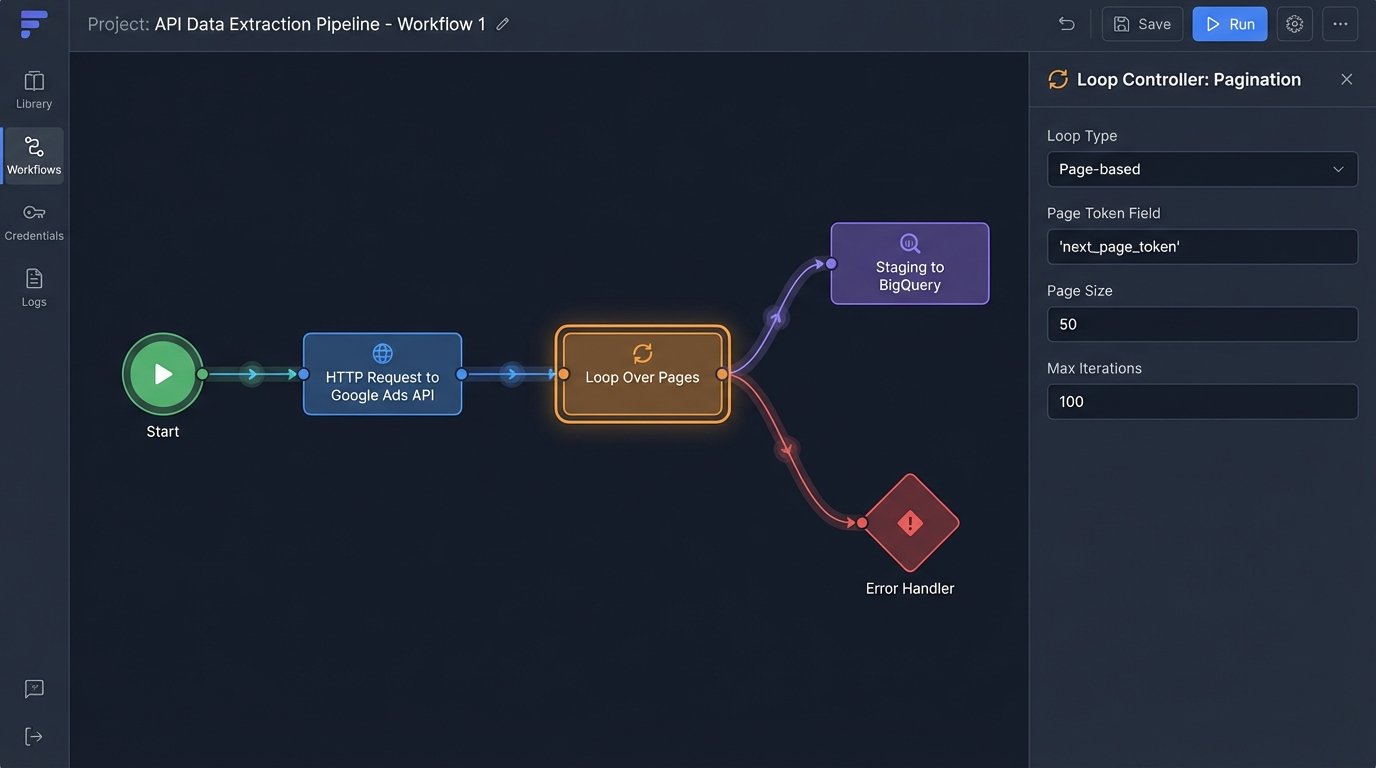
You’re fighting two immediate enemies: rate limits and pagination. Rate limits dictate how many calls you can make in a given time window. Hit the limit, and the API will shut you down. Pagination is how APIs deliver large datasets in smaller chunks or “pages.” Your script must be built to handle both, requesting one page at a time, respecting the rate limit, and looping until all data is retrieved.
For this, a custom script is often the most flexible tool. Python, with its ‘requests’ library, is the workhorse for this kind of task.
import requests

import time
API_KEY = "your_secret_api_key"
ENDPOINT = "https://api.someplatform.com/v2/data"
PAGE_SIZE = 100
def fetch_all_data():
all_records = []
page = 1
while True:
params = {
"api_key": API_KEY,
"page_size": PAGE_SIZE,
"page": page
}
try:
response = requests.get(ENDPOINT, params=params)
response.raise_for_status() # This will raise an exception for 4xx/5xx errors
data = response.json()
records = data.get("records", [])
if not records:
break # No more data to fetch
all_records.extend(records)
page += 1
# Simple rate limit handling: wait a moment before the next call
time.sleep(1)
except requests.exceptions.HTTPError as e:
print(f"API Error: {e.response.status_code} - {e.response.text}")
break
except requests.exceptions.RequestException as e:
print(f"Request failed: {e}")
break
return all_records
This code is a basic skeleton. A production-grade script needs more robust error handling, exponential backoff for retries, and serious logging. This is where managed ETL services like Fivetran or Stitch make their pitch. They handle the API maintenance and plumbing for you. The cost is financial. These services are wallet-drainers, often charging per row synced, but they can save you immense engineering time if your data sources are standard, like Salesforce or Google Ads.
The choice is simple: burn engineer hours or burn cash.
Phase 2: Staging and Transformation
Never dump raw API data directly into your final analytical tables. The source API might change, your transformation logic could have a bug, or you may need to reprocess historical data with a new business rule. The correct pattern is to load the raw, untouched JSON or XML from the API directly into a “staging” table in your warehouse. This table is your backup, a pristine copy of what the source system gave you.
Think of it as developing a photograph. You keep the negative (the raw data) so you can create new prints (transformations) later without having to stage the photoshoot all over again. Shoving raw, unstructured data from ten different systems into one final table is like forcing a firehose through a needle. It’s a messy disaster.
Once staged, the transformation work begins. This is where SQL becomes your primary tool. The objective is to hammer the disparate data structures into a single, coherent schema. For marketing data, this might look like a flattened table with columns for `event_date`, `source_platform`, `campaign_name`, `campaign_id`, `ad_spend`, `impressions`, `clicks`, and `conversions`. You write SQL queries that parse the raw JSON in your staging tables, clean up data types, standardize date formats, and map source-specific field names to your unified model.
Joining the Unjoinable
The real power comes from joining datasets. You can join cost data from Facebook Ads with session data from Google Analytics and lead quality data from a CRM. The key is finding a common identifier to bridge the tables. Often, this is a URL parameter like `utm_campaign` or a click ID that you pass from the ad platform to your website and into your CRM. Without a reliable join key, your datasets remain isolated islands.
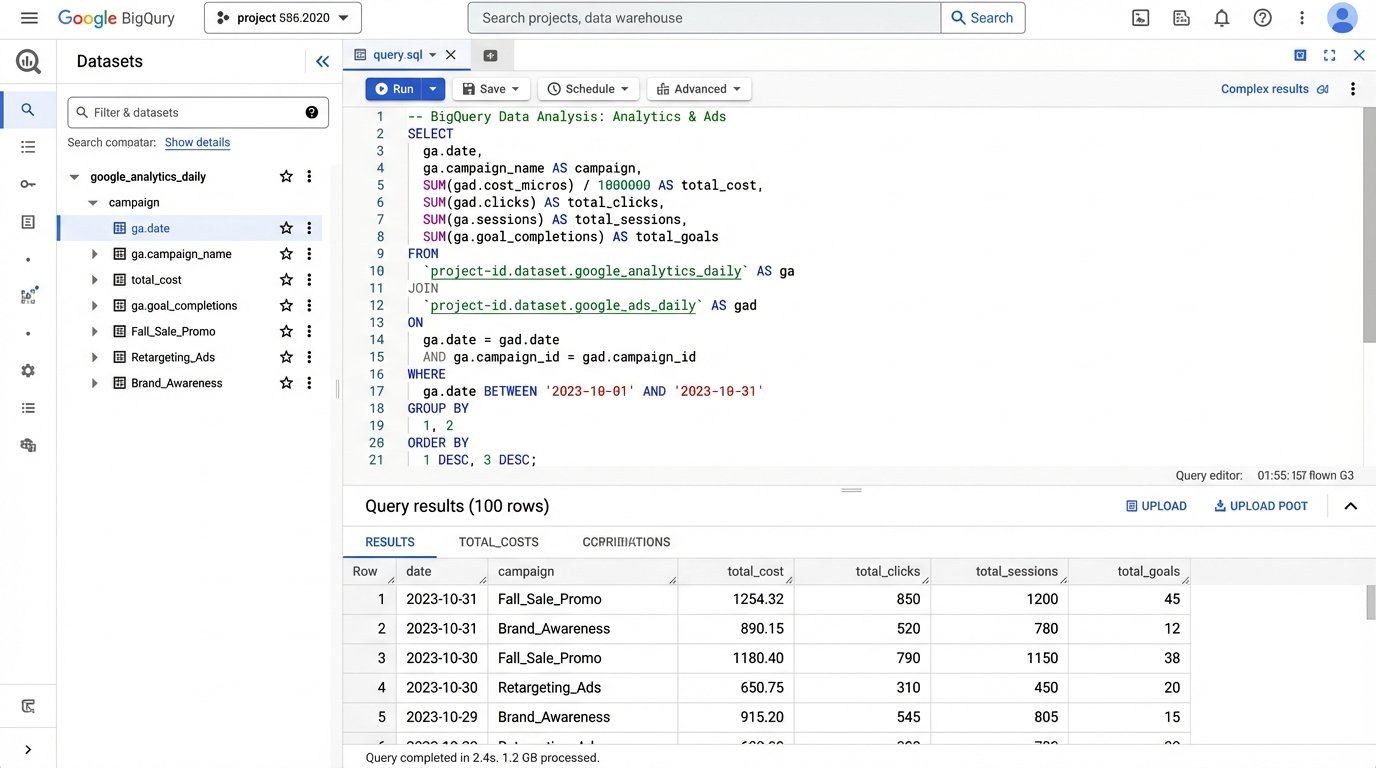
For example, to bridge Google Ads cost with website behavior, you might join on the campaign name and date.
SELECT

    ga.date,

    ga.campaign,

    gads.cost,

    gads.clicks,

    ga.sessions,

    ga.goal_completions

FROM

    `project.analytics_reporting.google_analytics_daily` AS ga

JOIN

    `project.analytics_reporting.google_ads_daily` AS gads

ON

    ga.date = gads.date AND ga.campaign = gads.campaign_name;
This query is simplistic. In reality, campaign names can be inconsistent. You might need to strip tracking parameters or apply regex to normalize them before a join is even possible. This cleaning and modeling is 90% of the work.
Phase 3: Loading and Visualization
With data cleaned and unified, the final step is to load it into a set of reporting tables. These are the tables that your BI tool, like Looker Studio or Tableau, will connect to. They should be fast, clean, and built for purpose. You might have one table for daily marketing performance and another for user-level event streams. These tables are the output of your entire pipeline, the payoff for all the extraction and transformation chaos.
Now you can build dashboards that answer critical questions. What’s the real cost per qualified lead, not just per form submission? Which blog post contributed the most to high-value signups three months later? You can finally map the entire customer journey, from the first ad impression to the final CRM status update, because all the data lives in one place and speaks the same language.
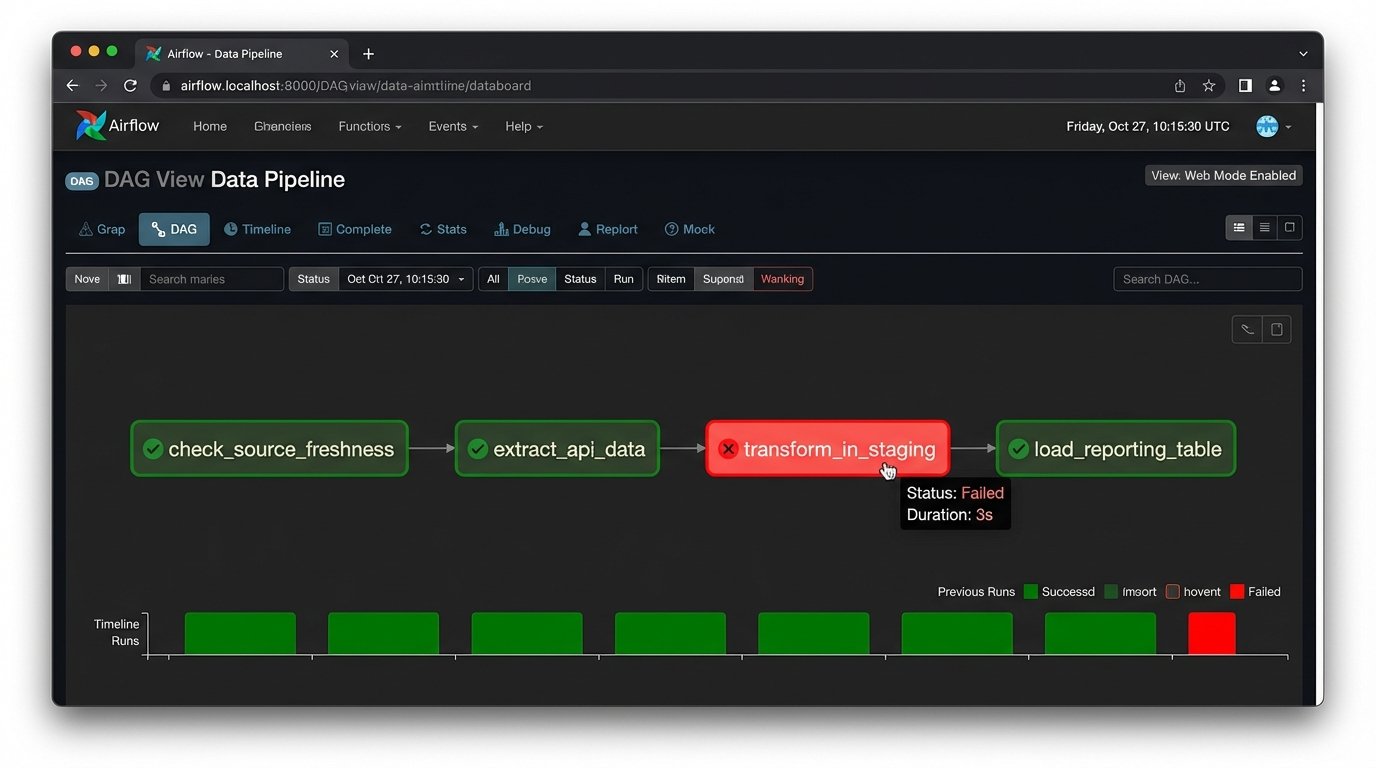
The Inevitable Failures: Maintenance and Monitoring
This automated system is not a “set it and forget it” machine. It’s a piece of critical infrastructure that will break. An API will deprecate an endpoint you rely on, sending your extraction script into a failure loop. A marketing manager will change a campaign naming convention without telling anyone, breaking your SQL joins. Your warehouse costs will spike because a faulty script starts pulling duplicate data.
Robust logging is non-negotiable. Every script run, API call, and SQL transformation must be logged. When the data looks wrong at 8 AM, you need a trail of breadcrumbs to find the point of failure. You must also implement alerting. A simple cron job that checks for data freshness can be a lifesaver. If your primary reporting table hasn’t been updated in 24 hours, an alert should be fired to your inbox or Slack channel.
Data validation is another layer of defense. Your pipeline should run automated checks to ensure the data integrity. For example, a check might verify that `ad_spend` is never negative or that the number of rows for yesterday’s data falls within an expected range. Catching these anomalies early prevents bad data from contaminating your reporting and eroding stakeholder trust.
Build vs. Buy: The Final Calculation
You have two paths to build this system. The “build” path involves writing custom Python scripts for extraction, using a workflow orchestrator like Apache Airflow to schedule and manage tasks, and running SQL transformations with a tool like dbt. This gives you absolute control and flexibility, but it demands significant engineering expertise and ongoing maintenance. You own the entire stack, for better or worse.
The “buy” path relies on a suite of SaaS products. You use a tool like Fivetran for extraction, load it into a managed warehouse like Snowflake, transform it with dbt Cloud, and visualize it in Tableau. This is much faster to set up and outsources the maintenance of API connectors. The price is paid in subscription fees and a degree of vendor lock-in. You’re trading control for convenience.
There is no universally correct answer. The decision depends entirely on your team’s skillset, budget, and timeline. An early-stage startup might stitch together a simple script, while a larger enterprise will likely absorb the cost of a managed solution to move faster. The one thing that’s certain is that the old way, the manual spreadsheet grind, is an operational liability. Building a centralized data pipeline isn’t just about making prettier charts. It’s about creating a stable, truthful foundation for every strategic decision the business makes.