
The Initial State: A Data Crisis Hidden in Plain Sight
A national real estate firm with over 80 franchise offices approached us with a reporting problem. Their corporate office operated blind. They had zero real-time visibility into agent performance, listing velocity, or commission pipelines. The root cause was a complete lack of system standardization across their network. Each franchise was an independent technical island, running its own mix of software for accounting, lead management, and property listings.
This wasn’t a simple case of messy data. It was a structural failure of information logistics.
Manual Processes and Fractured Systems
The core of their operations relied on a chain of manual data entry tasks. An agent would close a deal, and the office administrator would manually key that information into three separate systems. First, the local Multiple Listing Service (MLS) portal. Second, a local instance of QuickBooks for commission tracking. Third, a proprietary CRM that was more of a glorified contact list than a management tool. The process was slow, prone to human error, and fundamentally unscalable.
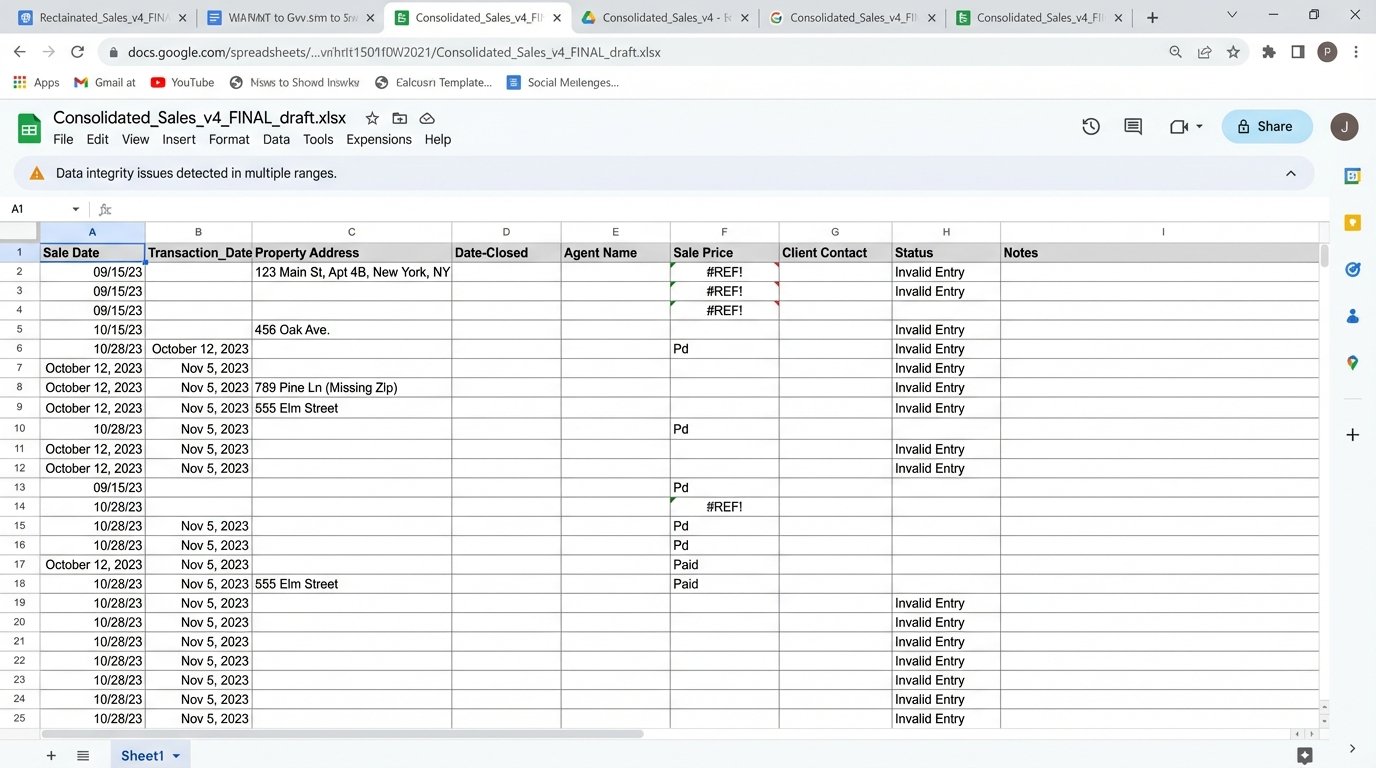
Corporate reporting was a quarterly fire drill. Each of the 80 offices would export several CSV files from their local systems. These files would be emailed to a single analyst at headquarters. This analyst’s job was to manually consolidate 240+ spreadsheets, each with different column headers, date formats, and naming conventions. The final report was typically six weeks late and riddled with inconsistencies that required dozens of follow-up calls to fix.
Data integrity was nonexistent. We audited a sample of 100 transactions and found a 14% error rate in commission calculations alone. Property addresses were formatted differently in every single source file, making it impossible to accurately track a property’s history or marketing spend without significant manual intervention. The lack of a unique identifier for properties or agents across the network meant duplicates were rampant.
The High Cost of Inefficiency
The operational drag was quantifiable. We calculated that office administrators spent a collective 350 hours per month on redundant data entry for closed deals. The quarterly reporting process consumed another 120 hours of a senior analyst’s time. The financial impact of miscalculated commissions and missed bonus payouts was estimated at over $200,000 annually, not including the damage to agent morale.
They couldn’t answer basic business questions. What is our average lead-to-close time? Which marketing channels generate the highest-value listings? Which agents are struggling and need additional training? All answers were based on gut feelings and outdated, inaccurate reports. This technical debt was actively preventing the franchise from growing effectively.
Architecting the Fix: A Centralized Data Backbone
Our solution was not to force a single CRM down everyone’s throat. The political capital required for such a move would have killed the project. Instead, we decided to build a lightweight, centralized data pipeline that would pull information from the existing source systems, standardize it, and load it into a central data warehouse for reporting and analysis.
We treated the franchise offices as black boxes. We didn’t care what they used internally, as long as we could get a data feed out of it.
Component Selection: Bypassing the Wallet-Drainers
The architecture needed to be effective without being a massive capital expenditure. We opted for a pragmatic stack. For the data warehouse, we chose Google BigQuery for its serverless nature and pay-per-query model, which was perfect for their variable reporting loads. For the integration and transformation logic, we deployed a series of Python scripts running on Google Cloud Functions. This avoided the cost and complexity of maintaining dedicated servers.
The workflow orchestrator was Apache Airflow, running on a small, managed instance. Airflow gave us the power to schedule the data pipelines, manage dependencies between tasks, and build in robust retry logic and alerting for when a source API inevitably went down. This was a critical piece. An automation system without solid error handling is just a faster way to create a mess.
The Integration Layer: Logic-Checking the Chaos
The heaviest lift was building the connectors to each source system. The various MLS portals had archaic REST APIs with inconsistent documentation and strict rate limits. The QuickBooks instances required us to build connectors that could differentiate between dozens of separately authenticated accounts. The custom CRMs were the worst, often requiring us to build scrapers to pull data when no API was available.
Each connector was designed to extract, transform, and load (ETL). The transformation step was where we solved the data integrity problem. We wrote Python functions to logic-check and sanitize every piece of incoming data. Addresses were standardized using the Google Geocoding API. Agent names were matched against a central roster to assign a unique ID. We defined a strict JSON schema for what a “transaction” object should look like, and every piece of incoming data was forced into this structure.
We were essentially trying to force three different shapes of data pegs (a messy JSON blob, a poorly formatted CSV, and a SOAP XML response from a system that time forgot) through one standardized square hole. The initial scripts were all about building the logic to shave down the edges of each peg before it ever hit the warehouse.
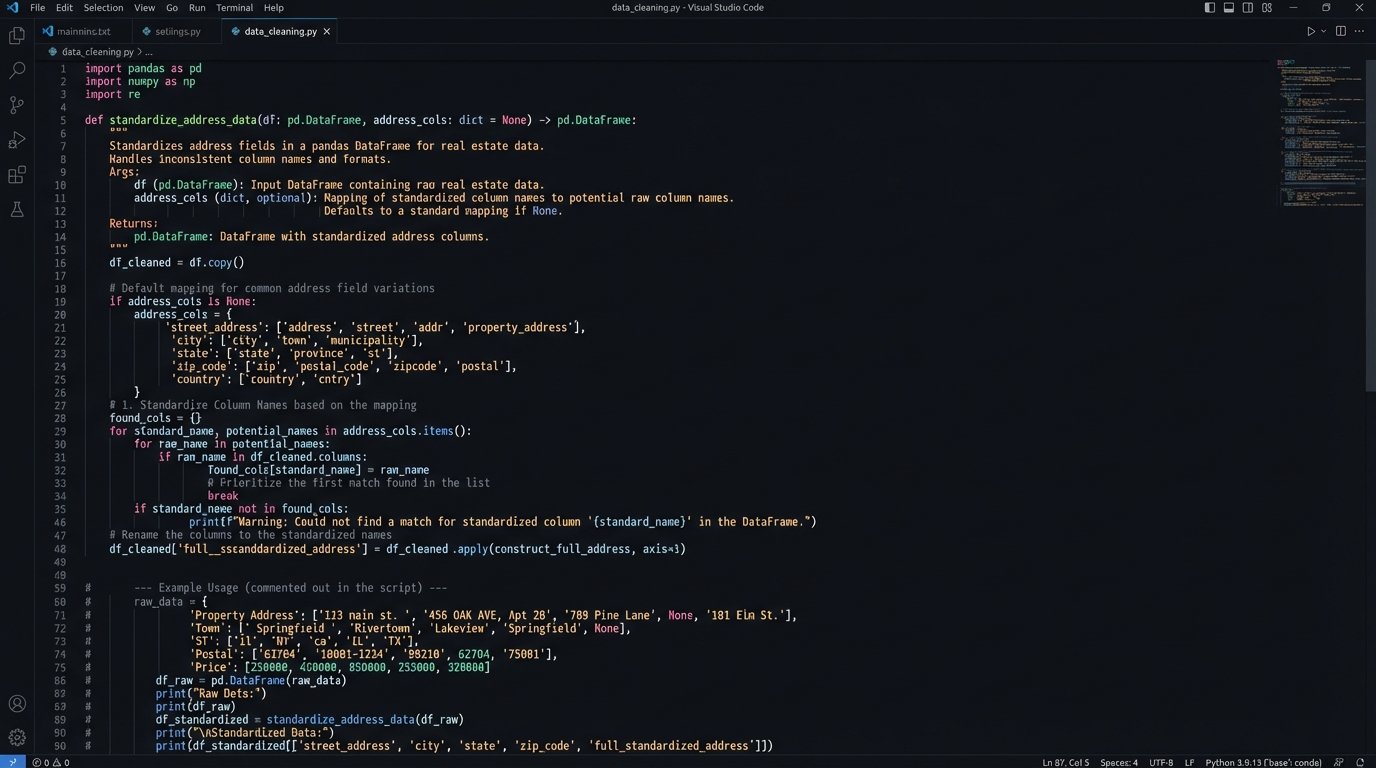
Here is a simplified example of a Python function used to standardize address data pulled from two different source systems before loading it into the pipeline. Notice the need to handle missing keys and inconsistent naming conventions (‘Street’ vs. ‘address_line_1’).
import pandas as pd

def standardize_address_data(source_a_df, source_b_df):
    """
    Standardizes address columns from two different DataFrame sources.
    Source A has columns: 'Street', 'City', 'State', 'Zip'
    Source B has columns: 'agent_id', 'address_line_1', 'city_name', 'state_abbr', 'postal_code'
    """

    # Process Source A
    processed_a = pd.DataFrame()
    processed_a['full_address'] = source_a_df.get('Street', '') + ', ' + \
                                  source_a_df.get('City', '') + ', ' + \
                                  source_a_df.get('State', '') + ' ' + \
                                  source_a_df.get('Zip', '').astype(str)

    # Process Source B
    processed_b = pd.DataFrame()
    processed_b['full_address'] = source_b_df.get('address_line_1', '') + ', ' + \
                                  source_b_df.get('city_name', '') + ', ' + \
                                  source_b_df.get('state_abbr', '') + ' ' + \
                                  source_b_df.get('postal_code', '').astype(str)

    # Simple logic to add a source identifier for traceability
    processed_a['data_source'] = 'MLS_System'
    processed_b['data_source'] = 'Internal_CRM'

    # Combine the standardized data
    standardized_df = pd.concat([processed_a, processed_b], ignore_index=True)

    # Basic cleanup
    standardized_df['full_address'] = standardized_df['full_address'].str.strip(', ')

    return standardized_df
This kind of defensive programming was necessary for every single data field. We assumed nothing about the quality of the input data.
Orchestration and Error Handling
The Airflow instance ran Directed Acyclic Graphs (DAGs) for each data source. A typical DAG for an MLS portal would run every hour. The first task would be to hit the API’s ‘recently_sold’ endpoint. The next task would transform the fetched JSON data, applying the standardization logic. A subsequent task would load this clean data into a staging table in BigQuery. A final task would merge the staging table into the main production table, handling any duplicates.
Alerting was configured to send a message to a specific Slack channel if any task failed more than three times. This was not a “set it and forget it” system. We knew that APIs change, credentials expire, and networks fail. The goal of the orchestration was to make the system resilient and to ensure that when it did break, we knew about it immediately, not six weeks later when a report was due.
Measurable Outcomes: Stripping Away the Guesswork
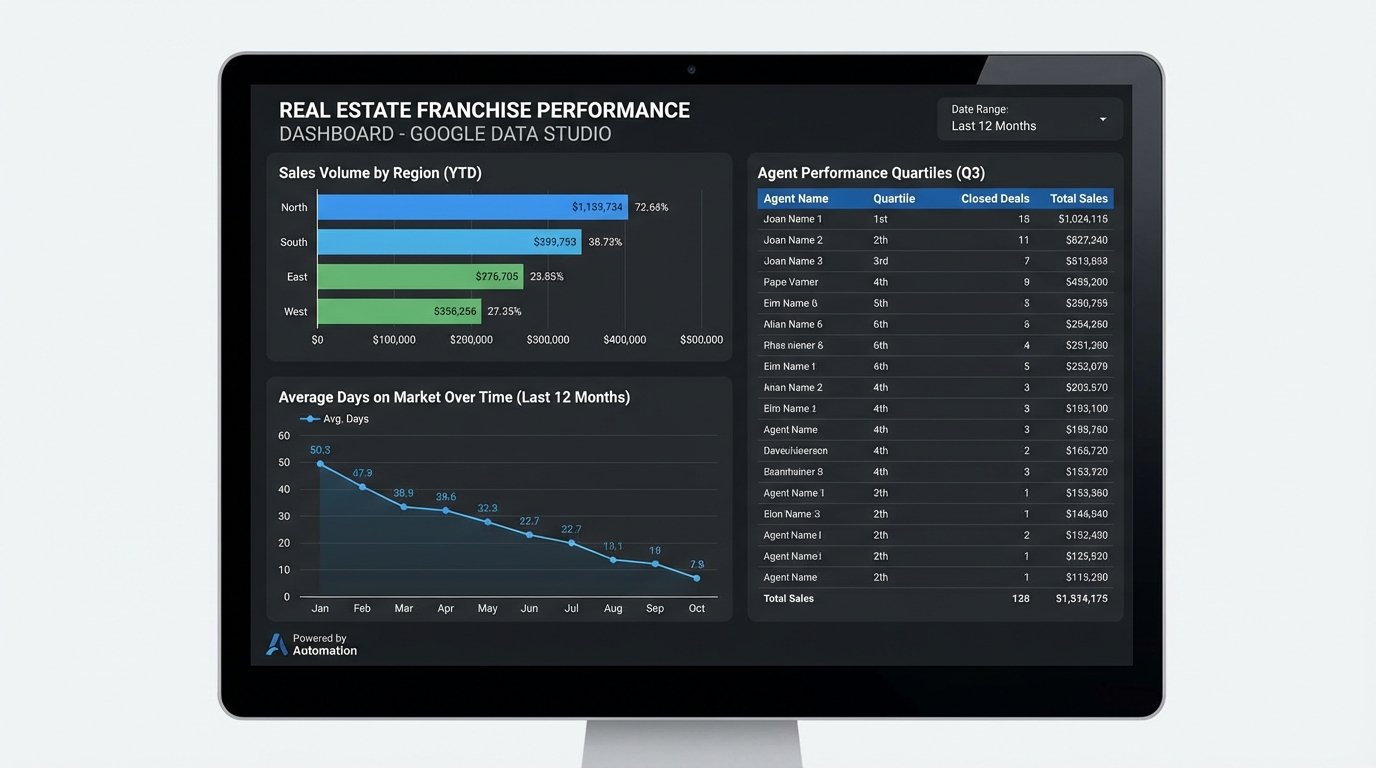
The project moved from architecture to production in four months. The new system began pulling data from all 80 franchises within the first week of deployment. The impact was immediate and significant. The corporate office went from having a six-week-old, inaccurate snapshot of the business to a dashboard, built in Google Data Studio, that updated every hour.
The transformation was stark. It was like going from navigating with a folded paper map to using a live GPS.
Hard KPIs and Operational Shifts
We tracked several key performance indicators to measure success against the initial state.
- Time-to-Report: The quarterly reporting process went from a 120-hour manual task to a fully automated dashboard. The time spent by the analyst dropped by 99%, freeing them up for actual analysis instead of data janitorial work.
- Data Entry Overhead: By pulling data directly from the MLS and accounting systems, we eliminated the need for duplicate entry by office administrators. This reclaimed an estimated 3,200 man-hours per year across the network.
- Commission Accuracy: With a single, standardized source of truth for transactions, commission calculation errors dropped to less than 1%. This directly saved the company money and improved its relationship with its agents.
- Business Insight: For the first time, leadership could accurately track metrics like average days on market per region, marketing ROI per channel, and agent performance quartiles. They used this data to identify an underperforming region and implement a targeted training program, which increased that region’s sales volume by 18% in the following six months.
The ability to segment performance data by franchise, agent, or property type gave them a strategic tool they never had before.
Unforeseen Hurdles and the Reality of Maintenance
The project was not without its problems. The initial data backfill from 80 different systems was a slog. We repeatedly hit API rate limits and had to negotiate temporary increases with three different MLS vendors. One of the proprietary CRMs had no export function at all, forcing us to write a Selenium-based web scraper that was brittle and required frequent maintenance for the first few months.
Ongoing maintenance is a reality. The system is stable, but it is not static. When a franchise switches its local software, we have to adapt the corresponding connector. We budget approximately 10 hours per month for this kind of support. The cost of this maintenance is a fraction of the cost of the old manual system, but it is not zero. Any automation project that claims to require zero upkeep is a fantasy.