7 Automated Analytics Workflows to Monitor Your Brokerage
Pulling reports manually is a failure pattern. It burns engineering hours on tasks that introduce human error, and by the time you spot a problem, the damage is already done. The alternative is building automated data pipelines that function as a nervous system for the brokerage, detecting deviations before they become outages or regulatory fines. These workflows are not about creating prettier dashboards for management. They are about building functional, high-signal monitors for the systems that actually generate revenue.
The goal is to move from reactive fire-fighting to proactive system validation. You stop asking “What broke?” and start getting alerts that say “This is about to break.” Most of these workflows can be assembled with a combination of scripting languages, message queues, and a time-series database. The complexity is not in the tools, but in the logic that stitches them together and correctly interprets the data.
1. Trade Execution Latency Monitoring
Latency is a direct tax on every trade. For any firm that cares about execution quality, monitoring the time gap between order receipt, exchange acknowledgement, and final fill is non-negotiable. This workflow requires parsing logs from multiple systems, each with its own timestamp format and potential for clock drift. The core task is to correlate a single order’s lifecycle across these distributed logs.
We typically build this by streaming application logs into a centralized collector like Fluentd, which then forwards structured data to a system like Elasticsearch or ClickHouse. The automation script then queries this datastore, joining events on a unique order ID. It calculates the delta between critical timestamps and flags any execution that exceeds a predefined threshold, for example, 500 microseconds for a colocated system. Trying to sync timestamps across unsynchronized servers is like trying to build a clock out of wet sand; NTP is a hard requirement, and PTP is better.
The trade-off is data volume versus granularity. Logging every single state change for every order generates a firehose of data that is expensive to store and process. You have to be surgical about what you log or accept sampling, which means you might miss sporadic outliers.
2. Regulatory Reporting Pre-Flight Check
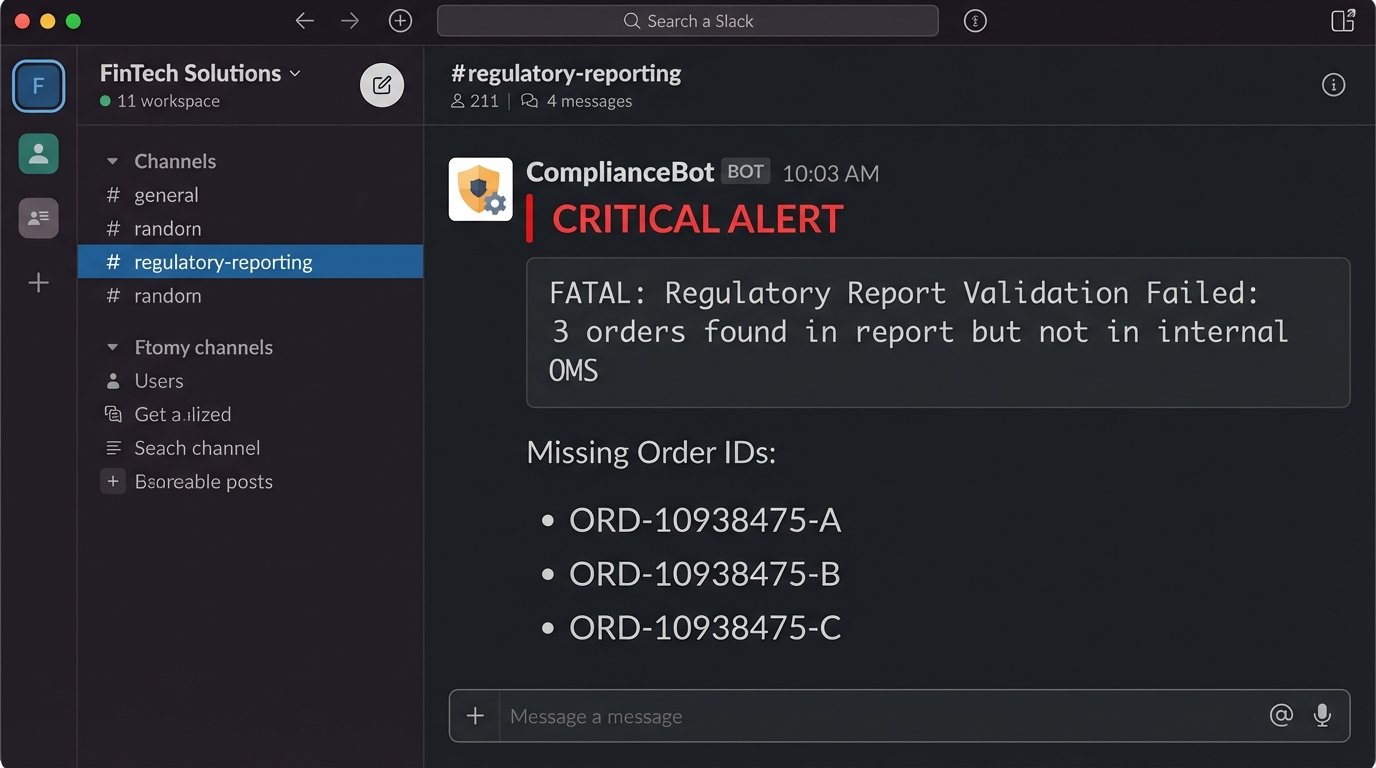
Submitting a malformed CAT or MiFID II report is a fast track to a regulator’s watchlist. This workflow is a data integrity shield that runs *before* a report is submitted. It validates the generated report files against a golden set of internal schemas and business rules. The automation acts as a brutal gatekeeper, rejecting any file that fails validation and preventing it from ever reaching the regulator’s portal.
The process involves a script, often Python with `lxml` for XML or `pandas` for CSVs, triggered when a report file lands in a specific directory. The script performs a multi-stage check:
- Schema Validation: Checks the file structure against the official XSD or file layout specifications. This catches basic structural errors.
- Data Coherency: Cross-references key data points like trade quantities or client identifiers against the firm’s internal order management system database. This catches logical errors the schema can’t.
- Exception Reporting: If validation fails, the script generates a detailed diff report pinpointing the exact error and sends it to a designated ops channel in Slack or Teams.
Here is a dead simple logic check to find orders in a report that do not exist in the internal database. This isn’t production code, but it shows the principle.
import pandas as pd
# Assume report_df is a DataFrame from the report file
# and internal_orders_df is from the firm's database
report_order_ids = set(report_df['OrderID'])
internal_order_ids = set(internal_orders_df['InternalOrderID'])
missing_orders = report_order_ids - internal_order_ids
if missing_orders:
print(f"FATAL: Report contains {len(missing_orders)} orders not found in internal DB.")
# Logic to block submission and send alert
for order_id in missing_orders:
print(f"Missing Order ID: {order_id}")
This adds a step to your release cycle. A simple schema change by the regulator requires you to update and redeploy your validation logic, turning a compliance update into an engineering task.
3. Client Profitability and Churn Prediction
Revenue per client is a vanity metric. True profitability accounts for commission, market data fees assigned to the account, and the support load they generate. This workflow automates that calculation. It pulls data from the trading system, the CRM, and the billing API to build a complete picture of an account’s financial footprint.
A nightly batch job, likely a SQL script run via a scheduler like Airflow, aggregates this data. It joins trade records with commission schedules, subtracts known costs, and flags accounts whose net profitability has trended down for a set period. The “churn prediction” part is often just a simple rules engine, not a machine learning behemoth. It flags accounts with a significant drop in trading volume or a sustained period of zero activity.
This data is gold for the sales and support teams, but it creates a single point of truth that is politically sensitive. When the data shows a “whale” client is actually unprofitable, expect pushback from the desk that covers them.
4. Market Data Feed Health Check
A brokerage operating on stale or corrupt market data is trading blind. This workflow is a watchdog for your incoming data feeds from exchanges or vendors. It does not check every single tick, but rather the statistical properties of the feed to detect anomalies. It’s designed to catch problems that the vendor’s own simple “heartbeat” monitor would miss.
A dedicated process subscribes to the data feed just like a trading engine. It maintains a running calculation of metrics per symbol, such as:
- Stale Tick Detection: Time since last update for a liquid symbol. If a symbol like SPY has not updated in over 500ms during market hours, an alert is fired.
- Gap Anomaly: A price change between consecutive ticks that exceeds a statistically normal value, for example, more than 5 standard deviations of the last 100 ticks.
- Symbol Drop-off: Monitors the total count of active symbols. A sudden, sharp decrease indicates a partial feed failure.
The main problem here is tuning the alert thresholds. Set them too tight, and you get a flood of false positives during legitimate volatility. Set them too loose, and you miss the subtle event that precedes a full-blown feed outage.
5. API Rate Limit and Error Budget Monitoring
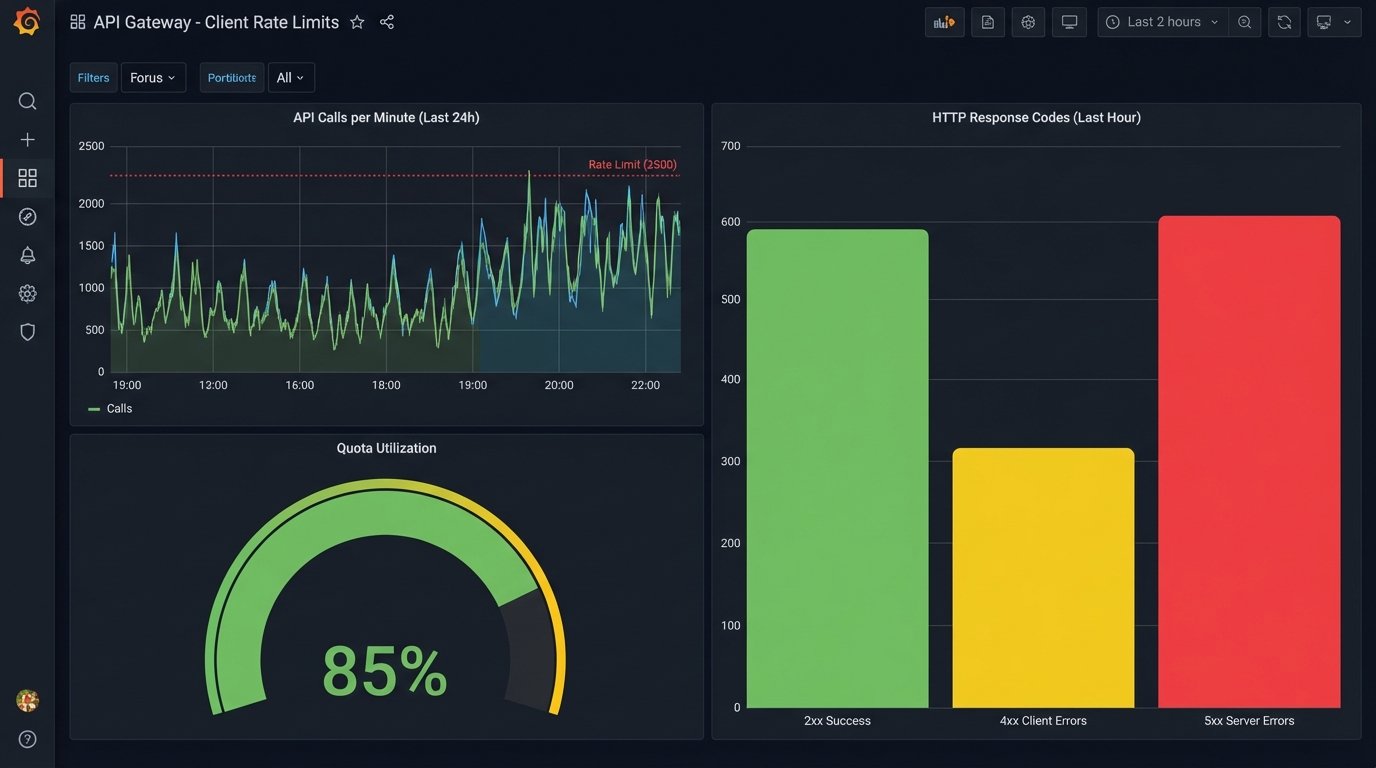
When your own internal services or your top clients get hit with a 429 “Too Many Requests” error, it’s an operational failure. This workflow is about monitoring API usage against published limits to prevent self-inflicted outages. It scrapes logs from the API gateway or load balancer to track request counts and error rates per client API key or internal service token.
You can force this data out of your gateway logs using a parsing agent that feeds a time-series database like Prometheus. A dashboard in Grafana then visualizes the request rate against the hard limit, along with the HTTP status codes. The real automation comes from the alerting rules. You set a trigger when usage hits 80% of the allowed quota, sending a warning to the client or the internal team responsible. Another alert fires when the 5xx error rate breaches its Service Level Objective (SLO) for more than five minutes.
This setup exposes how poorly some internal systems behave. You will inevitably find a legacy service that polls an endpoint in a tight loop instead of using a webhook, single-handedly consuming the entire rate limit.
6. Automated Risk Exposure Snapshot
A brokerage’s total market risk is fragmented across different systems, asset classes, and accounts. This workflow’s job is to gut those systems, pull the raw position data, and aggregate it into a single, coherent snapshot. This is not for real-time risk management, which requires a dedicated engine, but for providing a periodic, system-wide view for the risk and finance departments.
This is a classic ETL (Extract, Transform, Load) task. A scheduled script connects to the databases of the equity, options, and futures systems. It extracts all open positions, normalizes the data into a standard format, and enriches it with current market prices fetched from a data vendor. The final, aggregated data is pushed into a data warehouse or a simple database for reporting. Pulling position data from three different legacy systems is like trying to translate a conversation between people speaking three different languages with a broken dictionary.
The biggest headache is data consistency. If you pull from the equities system at 16:01:05 and the futures system at 16:01:10, you are not looking at a true snapshot in time. You either accept this small inconsistency or you engineer a much more complex solution involving system-wide locking, which introduces its own risks.
7. Cost of Execution Analysis (TCA)
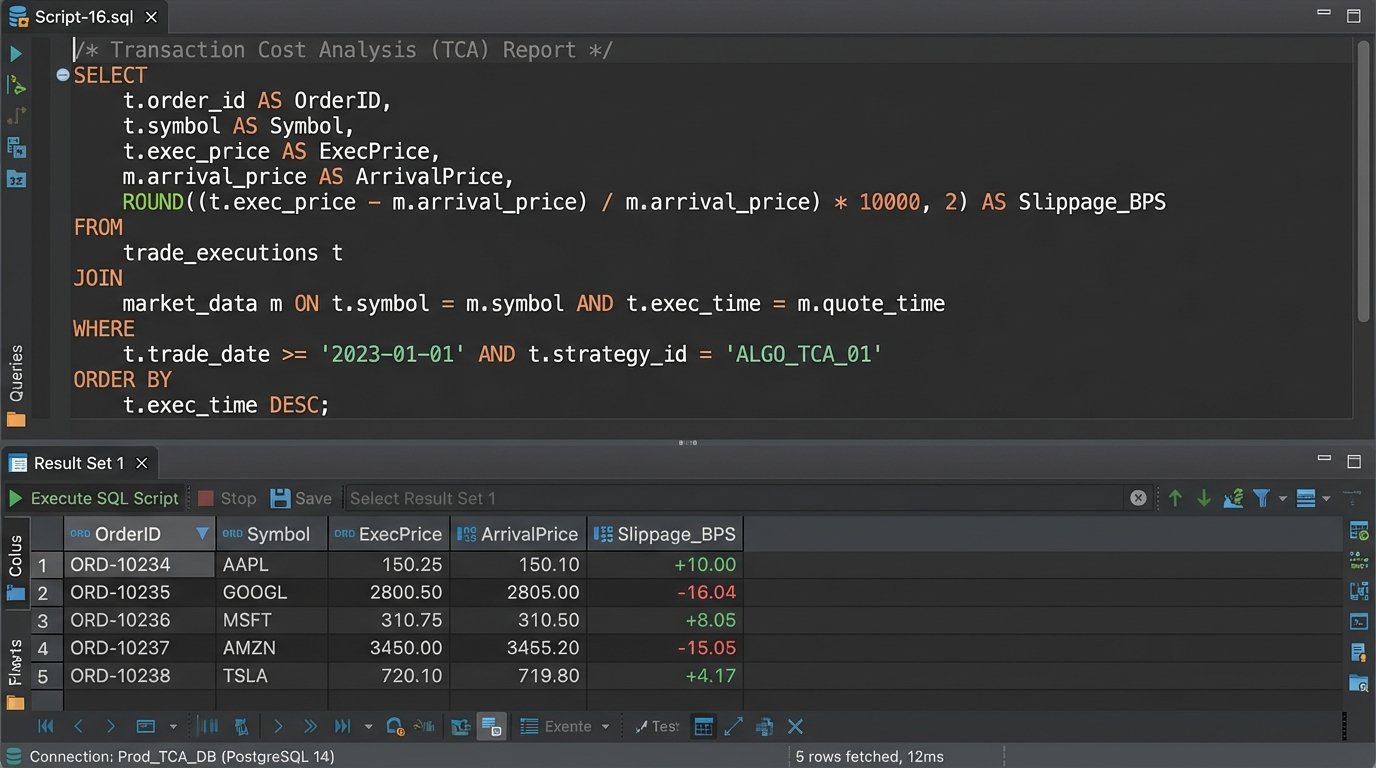
Proving “best execution” is a regulatory minefield. Transaction Cost Analysis (TCA) is the process of quantifying how well you executed an order compared to a market benchmark. This workflow automates the calculation by comparing your firm’s trade records against historical market data, measuring the implementation shortfall or price improvement.
For each child order fill, a script fetches two key data points: the execution price from your internal records and the benchmark price from a historical tick database. A common benchmark is the Volume Weighted Average Price (VWAP) over the life of the order. The script calculates the “slippage,” which is the difference between your execution price and the benchmark. A positive slippage on a buy order is bad; a negative one is good.
-- Simplified SQL concept to calculate slippage against arrival price

SELECT

    t.OrderID,

    t.ExecPrice,

    m.Price AS ArrivalPrice,

    (t.ExecPrice - m.Price) AS Slippage -- For a buy order

FROM

    TradeFills t

JOIN

    MarketData m ON t.Symbol = m.Symbol

    AND m.Timestamp = (

        -- Find the market price at the exact moment the order arrived

        SELECT OrderTimestamp FROM Orders o WHERE o.OrderID = t.OrderID

    )

WHERE

    t.TradeDate = 'YYYY-MM-DD';
This workflow is entirely dependent on the quality and cost of your historical market data. Access to granular, timestamped tick data is a wallet-drainer. Using lower-quality, aggregated data (like one-minute bars) for the benchmark will produce TCA numbers that are, at best, inaccurate and, at worst, misleading.