
The proptech space is saturated with platforms promising to solve everything with a slick UI and a fat monthly subscription. Most are just wrappers around public data with an API that breaks if you look at it wrong. The real work is in the integration, the data mapping, and figuring out which tool actually has the engineering backbone to survive in a production environment.
We tore down seven of them to see what’s under the hood. Some are useful. Others are just another vendor lock-in waiting to happen. Here’s the unfiltered breakdown for people who actually have to connect these systems.
1. Reonomy: The Commercial Data Aggregator
What It Claims to Do
Reonomy positions itself as the source of truth for commercial real estate data. It ingests a massive volume of public and proprietary data, from tax assessments and transaction histories to debt and ownership information. The goal is to provide a unified, queryable dataset on virtually every commercial property in the country.
The Technical Reality
Its core value is the data graph, which connects properties to owners, LLCs, tenants, and loan portfolios. The API is RESTful and reasonably well-documented, allowing you to pull property-level data based on geographic, physical, or financial criteria. The entity resolution it performs to link shell companies to actual owners is its most powerful, and opaque, feature.
The main problem is data latency. Public records are not real-time, and Reonomy’s ingestion pipeline can have a significant lag. You might be pulling ownership data that’s three to six months out of date, which is a deal-breaker for time-sensitive acquisitions. You have to build your own logic-checks to cross-reference critical data points against a more current source, defeating part of the purpose.
A Use Case That Doesn’t Fail
Use it for macro-level market analysis or initial lead generation, not for final due diligence. We built a pipeline that pulls a list of all multi-family properties in a specific county with loans maturing in the next 12 months. This list is then injected into a Salesforce campaign for the brokerage team. It’s a batch process that runs weekly, which tolerates the data lag just fine.
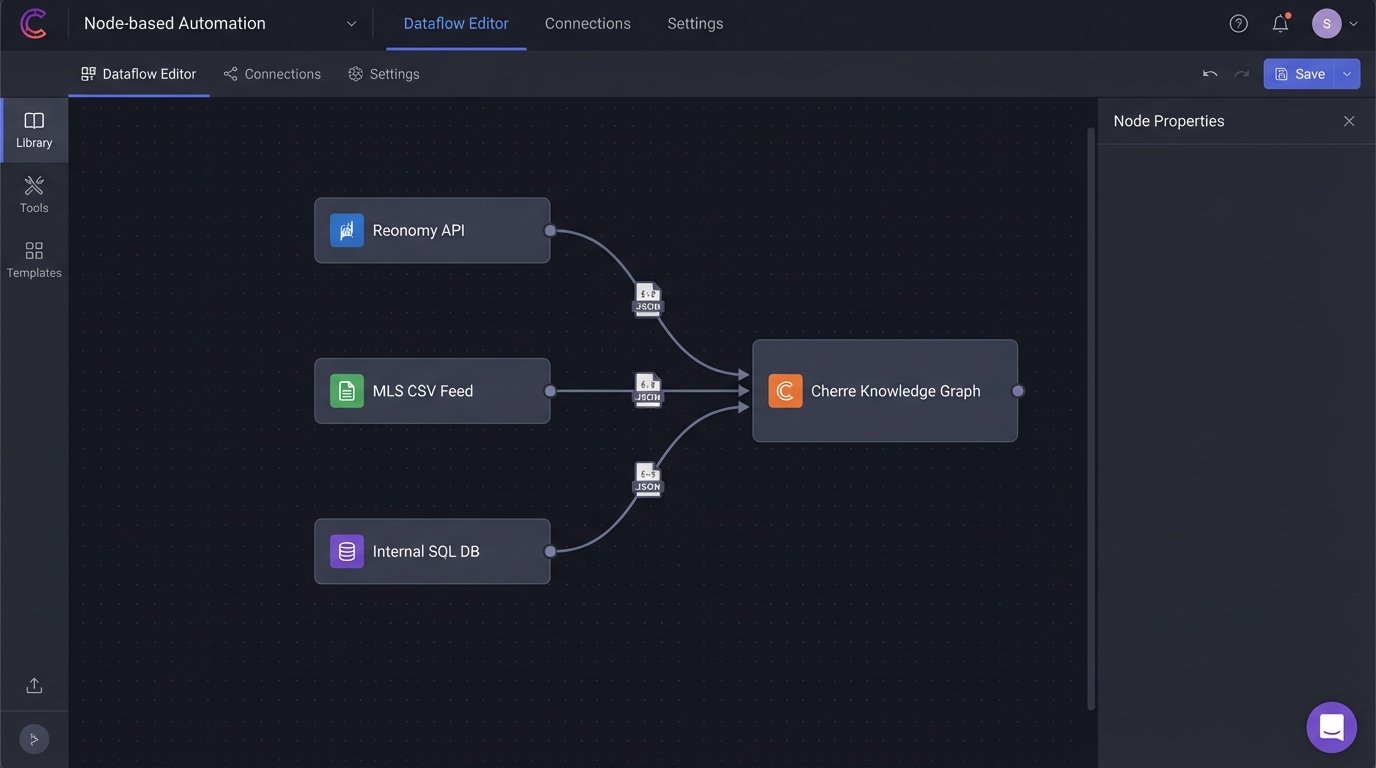
2. Cherre: The Data Integration Platform
What It Claims to Do
Cherre doesn’t sell data directly. It sells the pipeline and the schema to connect all your other data sources. The pitch is that you can plug in your MLS feeds, your Reonomy subscription, your internal transaction records, and it will resolve, clean, and structure everything into a single queryable knowledge graph. It’s a data warehouse as a service, specifically for real estate.
The Technical Reality
Getting data into Cherre is the entire job. It requires a significant upfront investment in writing custom connectors and mapping your disparate data schemas to their canonical model. This process is like trying to force a stream of unstructured text through a rigid, unforgiving parser. It exposes just how messy your source data really is. Once the data is in, querying via their GraphQL API is fast and effective.
The platform is a wallet-drainer. You are paying for the infrastructure and the pre-built connectors they support, and the cost scales with data volume and complexity. If your primary data sources are already clean and well-structured, you might be better off building your own data lake on a standard cloud provider for a fraction of the cost.
A Use Case That Doesn’t Fail
An institutional asset manager uses Cherre to blend their internal portfolio performance data with third-party market data from providers like LightBox and Trepp. This allows them to build dashboards that benchmark their own asset performance against the broader market in real-time. They accepted the high cost because the engineering effort to build and maintain this system in-house would have been even higher.
3. Placer.ai: Foot Traffic and Geolocation Analytics
What It Claims to Do
Placer.ai provides anonymized location data from mobile devices to analyze foot traffic at retail locations, malls, and commercial venues. It allows you to visualize traffic patterns, understand customer demographics, and conduct trade area analysis without expensive, manual surveys.
The Technical Reality
The platform’s strength is its data visualization front-end. It’s easy to pull up a property and see charts on visitor counts, dwell times, and cross-shopping behavior. The API, however, feels like an afterthought. It provides access to the raw metrics but lacks the more advanced analytical functions of the UI. Exporting large datasets for custom analysis is sluggish.
Data granularity can also be an issue. In dense urban areas, distinguishing traffic between two adjacent storefronts is problematic. The system can struggle to pinpoint whether a device ping belongs to the coffee shop or the bank next door. You have to treat the numbers as highly directional indicators, not as perfect ground truth.
A Use Case That Doesn’t Fail
A retail brokerage team uses Placer.ai to validate a potential tenant’s fit for a specific shopping center. Before pitching a lease, they run an analysis on the tenant’s existing locations to identify the trade area and customer demographics. They then compare this profile to the visitor profile of the target shopping center. It’s a data-driven way to argue for tenant synergy, and it bypasses emotional arguments during negotiation.
4. VTS: Leasing and Asset Management Platform
What It Claims to Do
VTS is a workflow tool for commercial leasing and asset management. It centralizes deal pipelines, tenant information, and portfolio analytics for landlords and brokers. The goal is to get leasing teams out of spreadsheets and into a unified system that tracks every stage of a lease negotiation.
The Technical Reality
The platform is essentially a specialized CRM for commercial real estate. Its API allows you to pull deal data, lease details, and property availabilities. The main integration challenge is synchronizing this data with accounting systems like Yardi or MRI. VTS tracks the deal pipeline, but the accounting system owns the financial record of truth once a lease is executed.
Building a two-way sync is a nightmare. The object models are fundamentally different, and you have to construct a complex middleware layer to handle the translation. For example, mapping VTS’s concept of “Net Effective Rent” to the specific general ledger codes in Yardi is a brutal, manual process that requires deep domain expertise. An error in this sync can cause serious financial reporting issues.
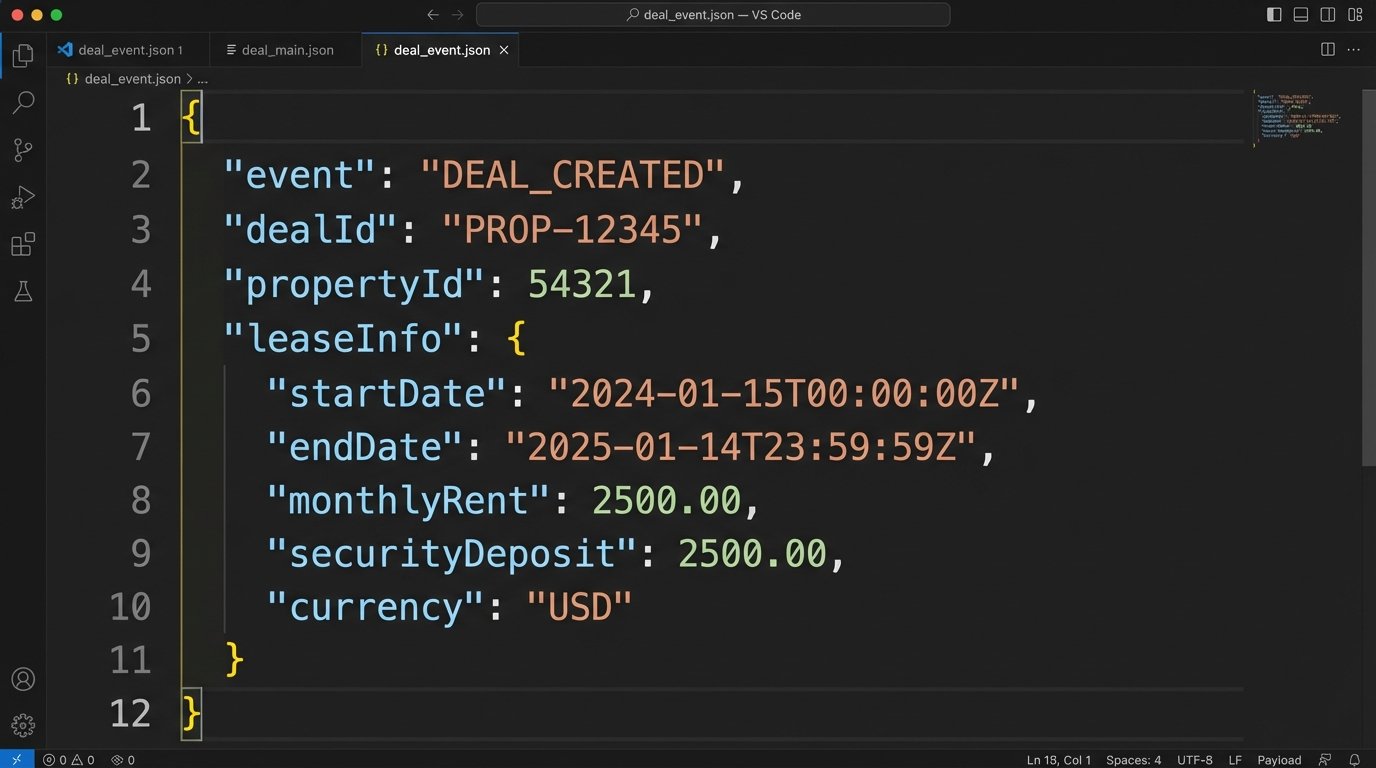
Here is a simplified payload you might get from a VTS webhook when a deal stage changes. Your job is to parse this and figure out what financial entries need to be updated.
{

  "event": "deal_stage_changed",

  "dealId": "DEAL-8675309",

  "propertyId": "PROP-1138",

  "tenantName": "Cyberdyne Systems",

  "previousStage": "Touring",

  "currentStage": "Lease Out",

  "leaseInfo": {

    "leaseExecutionDate": null,

    "leaseCommencementDate": "2024-12-01",

    "suite": "Suite 404",

    "squareFootage": 5280,

    "monthlyRent": 25000.00,

    "termMonths": 60

  },

  "timestamp": "2023-10-26T14:30:00Z"

}
A Use Case That Doesn’t Fail
A REIT uses VTS as their single source for leasing activity. They built a one-way data feed from VTS into their business intelligence tool (Tableau). This allows the executive team to view portfolio-wide leasing velocity, exposure by industry, and broker performance without ever logging into VTS. They deliberately avoided a two-way sync to minimize complexity and risk.
5. Procore: Construction Management Software
What It Claims to Do
Procore is an all-in-one platform for managing construction projects. It handles everything from bidding and RFIs to project financials and scheduling. The intent is to connect the field teams, the project managers, and the back office on a single system to reduce errors and delays.
The Technical Reality
It’s a massive, sprawling system with a correspondingly massive API. The API is extensive and gives you granular control over almost every entity in the system, from drawings to change orders. The learning curve is steep. The sheer number of endpoints and the specific workflow dependencies you need to respect make it a heavy lift for any integration project.
The biggest architectural problem is its “one-size-fits-all” data model. It tries to be everything to every type of construction project, which means the schema is bloated with fields that may be irrelevant to your specific use case. Pulling a simple report can require joining data from a half-dozen different endpoints and then stripping out the noise. It’s like being handed an entire factory schematic when you just wanted to know the torque spec for a single bolt.
A Use Case That Doesn’t Fail
A general contractor integrated Procore’s financials module with their corporate ERP (NetSuite). They built a service that runs nightly, pulling approved change orders and subcontractor invoices from Procore. The service then transforms this data and injects it into NetSuite to automate the accounts payable process. This saves hundreds of hours of manual data entry and reduces clerical errors.
6. Esri ArcGIS: The Geospatial Analysis Engine
What It Claims to Do
Esri is the old guard of Geographic Information Systems (GIS). ArcGIS isn’t a single tool, but an entire ecosystem for creating, managing, and analyzing geospatial data. For real estate, it’s used for everything from site selection and zoning analysis to creating detailed property maps for marketing materials.
The Technical Reality
This is not a plug-and-play solution. Integrating with ArcGIS means dealing with a complex world of feature layers, map services, and arcane spatial data formats. The REST API is powerful but adheres to its own unique conventions, which are different from typical web APIs. Authentication can be a pain, often requiring you to manage short-lived tokens.
Performance is a constant concern. Geospatial queries are computationally expensive. A poorly constructed query asking for all parcels within a complex polygon can bring a server to its knees. You have to be aggressive with caching, simplifying geometries, and strategically pre-rendering map tiles to create a usable front-end experience. Rate limiting on their cloud services is unforgiving.
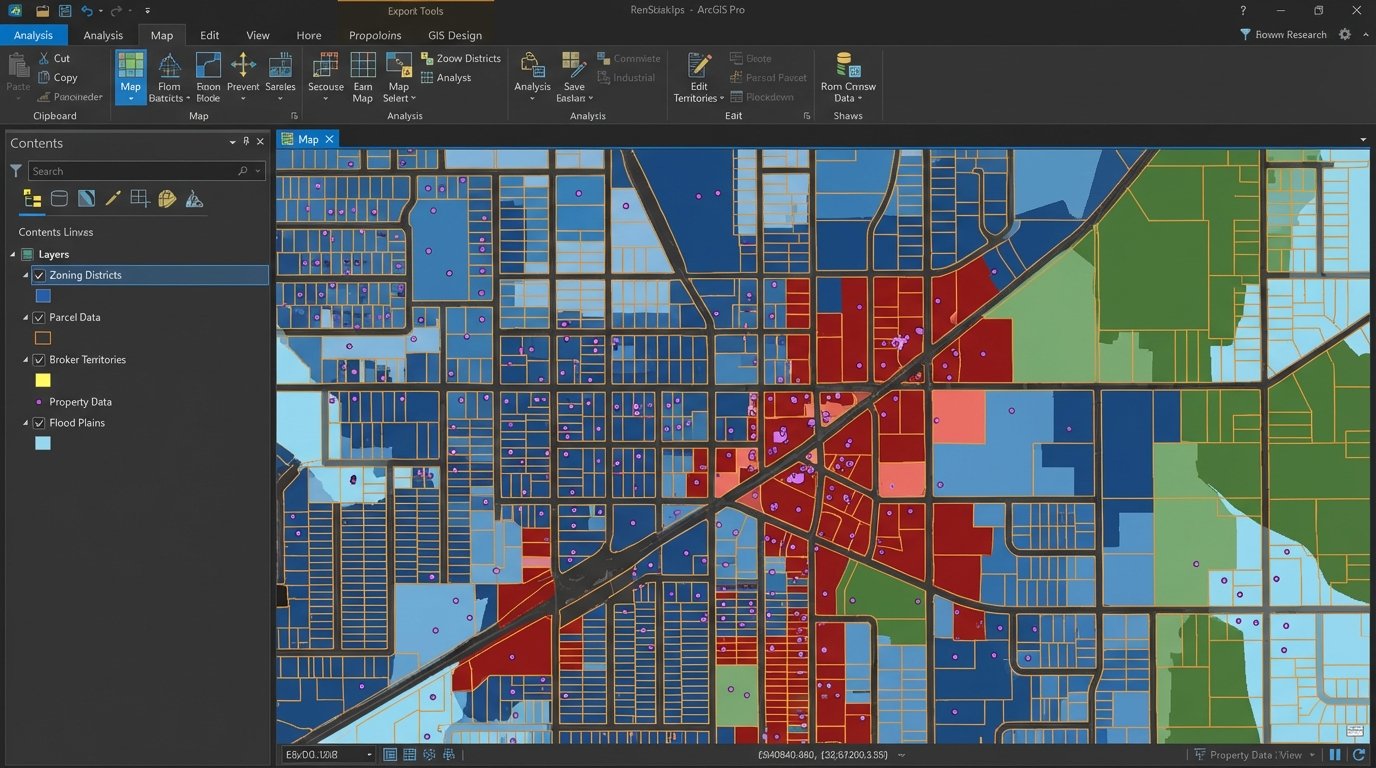
A Use Case That Doesn’t Fail
A national brokerage firm uses ArcGIS to power the property search on their public website. They maintain a private ArcGIS Enterprise server that hosts their proprietary data layers, including neighborhood boundaries and broker territories. This data is overlaid on top of public parcel data. The web application queries this server to display rich, interactive maps that are far more detailed than a standard Google Maps embed.
7. Enodo: Multi-family Underwriting and Analysis
What It Claims to Do
Enodo, now part of Walker & Dunlop, is a platform designed to automate multi-family underwriting. You input a property’s address, and it pulls in market data, comps, and demographic information to generate a pro forma financial model and estimate a potential return on investment.
The Technical Reality
The platform’s value is its speed. It can produce a first-pass analysis in minutes, a task that would take an analyst hours in Excel. The underlying model is a black box, however. The API allows you to input property assumptions and extract the resulting financial projections, but it provides little visibility into how it calculates key metrics like market rent growth or vacancy rates.
This lack of transparency is a major issue for serious underwriting. You can’t fully audit the model or easily adjust its core algorithms to fit your own market thesis. It’s a tool for quick screening, not for final investment decisions. Relying on it blindly is a recipe for disaster when its market assumptions, which are baked into the system, turn out to be wrong.
A Use Case That Doesn’t Fail
An acquisitions team uses Enodo as a filtering mechanism at the top of their deal funnel. They run every potential deal through the platform to quickly identify properties that meet their basic investment criteria. Only the deals that pass this initial, automated screen are passed on to analysts for a full, manual underwriting process in their own proprietary Excel models. It saves time by eliminating non-starters early.