
Stop Trusting Your Automated Reports
A C-level executive just made a six-figure decision based on a dashboard you built. The underlying data, piped in by your automation script, was wrong. The API source quietly changed a field name from `revenue` to `revenue_usd` last night, your script failed silently, and the revenue column in the database now contains three days of nulls aggregated as zero. This is not a hypothetical.
Automated reporting isn’t a “set and forget” victory lap. It’s a system with multiple, cascading points of failure. The goal isn’t to build a perfect, unbreakable chain. The goal is to build a system that screams, loudly and specifically, when a single link breaks. Trusting the output without validating the process is professional negligence.
The Three Points of Failure: Ingestion, Transformation, Presentation
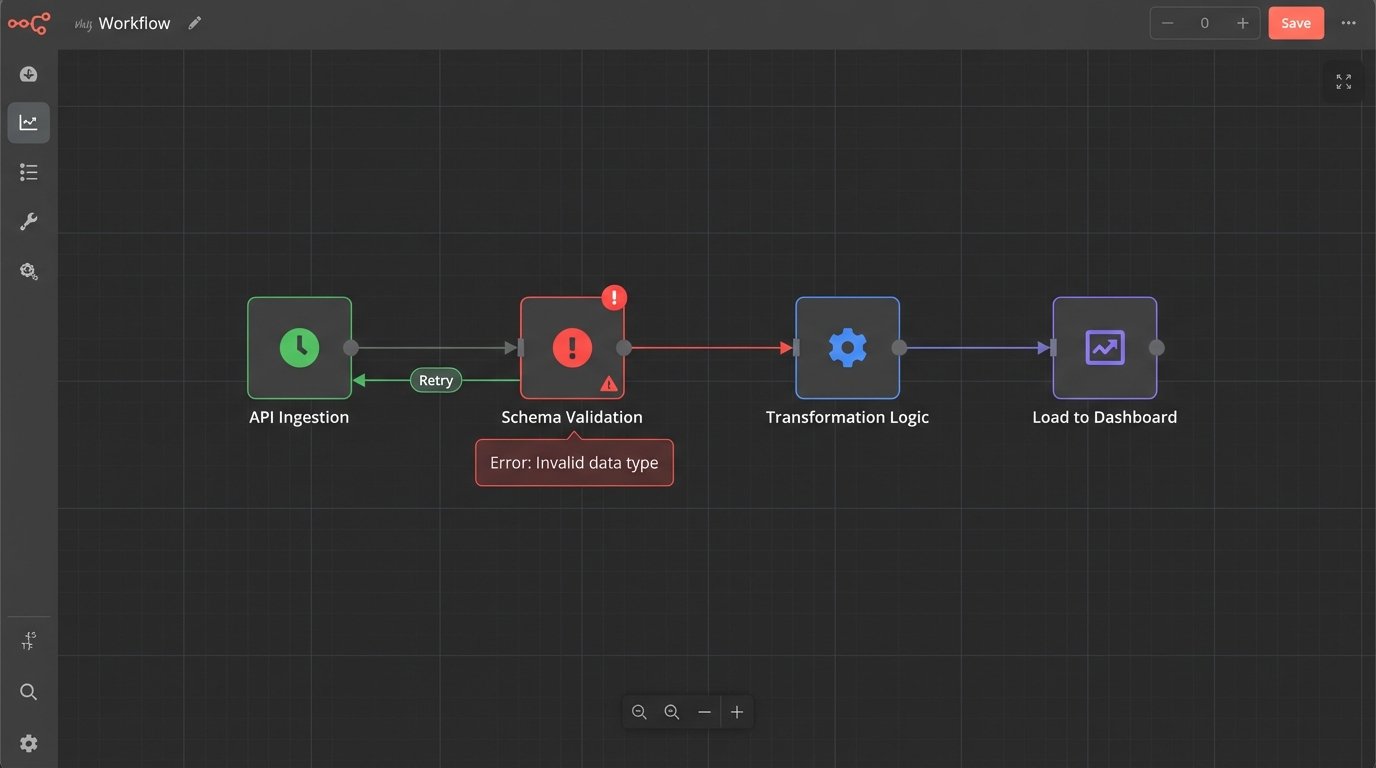
Every automated reporting pipeline breaks down into three stages. Data is ingested from a source, transformed into a usable format, and then presented in a report or dashboard. Corruption at any stage poisons the entire system. We fix this by building bulkheads between each stage, logic-checking the payload as it passes through.
Thinking you can solve data quality by just fixing the dashboard is like trying to fix a foundation by painting the walls. You have to go to the source.
Stage 1: Defensive Ingestion
The most fragile part of any automation is its reliance on external systems you don’t control. APIs change without warning, authentication tokens expire, and networks drop packets. Your ingestion script must be built with the paranoid assumption that the source is actively trying to feed it garbage.
The first line of defense is forcing a contract on the data source. Before you even try to process the data, you validate its structure. If you expect a JSON object with five specific keys, your script should first check for the existence and data types of those five keys. If the check fails, the entire run is aborted and an alert is fired. Do not pass go, do not ingest poison.
Here is a basic structural check using Python’s Pydantic library. The script expects specific fields and types. If the incoming JSON from the API call doesn’t match this `ExpectedSchema`, the script will raise a `ValidationError` immediately, stopping the pipeline before bad data gets in.
from pydantic import BaseModel, ValidationError

from typing import Optional
class ExpectedSchema(BaseModel):
user_id: int
session_id: str
event_timestamp: str
revenue_usd: Optional[float] = 0.0
# Simulated JSON data from an API call
api_data = [
{'user_id': 101, 'session_id': 'abc-123', 'event_timestamp': '2023-10-27T10:00:00Z', 'revenue_usd': 99.99},
{'user_id': 102, 'session_id': 'def-456', 'event_timestamp': '2023-10-27T10:05:00Z'}, # Missing revenue is ok, defaults to 0.0
{'user_id': '103', 'session_id': 'ghi-789', 'event_timestamp': '2023-10-27T10:10:00Z', 'revenue_usd': 50.0} # 'user_id' is a string, not an int
]
for record in api_data:
try:
validated_record = ExpectedSchema(**record)
print(f"OK: {validated_record.model_dump_json()}")
# Proceed with inserting 'validated_record' into the raw data layer
except ValidationError as e:
print(f"ERROR: Schema validation failed for record: {record}")
print(e)
# Fire an alert, halt the pipeline
# Do NOT process this record
This simple code block prevents a type mismatch from corrupting an entire column. The script now fails loudly instead of silently inserting bad data.
Next, you have to handle API flakiness. Rate limits, 503 errors, and network timeouts are not edge cases, they are operational certainties. A script that fails on the first dropped connection is useless. Implement an exponential backoff retry mechanism for all network calls. The script should try again after 2 seconds, then 4, then 8. If it fails after a set number of retries, it must terminate and send a high-priority alert.
Never let your script guess. If an API call returns an ambiguous 200 OK with an empty payload, is that a successful query that found no new data, or did the API fail and return nothing? Your script must be coded to differentiate. Check content length, look for expected JSON structures. An empty response when data is expected is a failure state.
Stage 2: Immutable Raw Layers and Logical Transformation
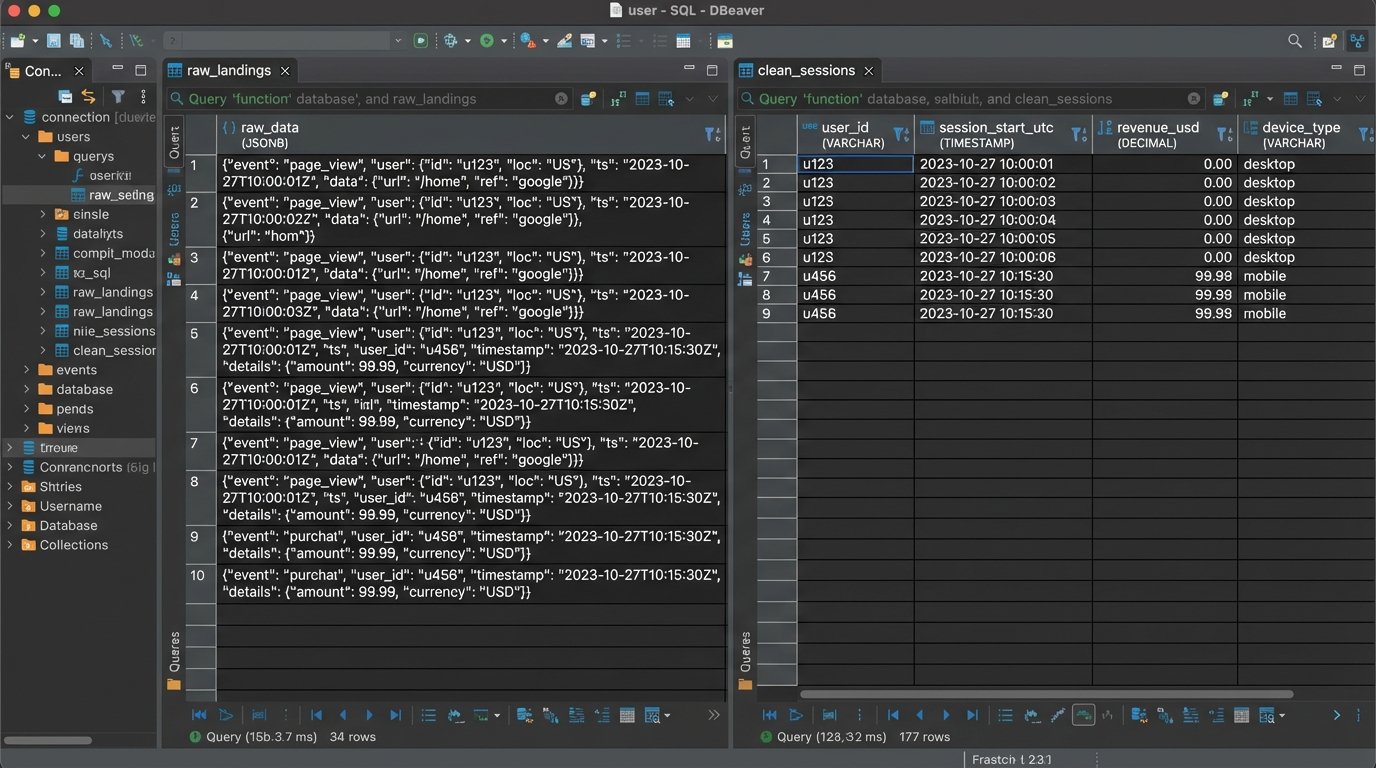
Once data is ingested, it must be stored before any transformations are applied. The biggest mistake engineers make is transforming data “in-flight” and loading the cleaned result directly into the final reporting tables. This is a destructive process. If you discover a flaw in your cleaning logic, you have no way to reprocess the original data. You have permanently lost the ground truth.
The solution is to maintain an immutable raw data layer. Every payload successfully ingested from the source is dumped, timestamped, and stored as-is in a dedicated table or file store. This raw data is never touched again. Your transformation scripts read from this raw layer, apply their logic, and write the output to separate, “clean” tables. If a bug is found in the transformation logic, you truncate the clean tables, fix the code, and re-run the transformation against the pristine raw data.
Treating your raw data layer as mutable is like editing a camera’s negative with a permanent marker. It’s an irreversible act of destruction that eliminates your ability to fix future processing errors.
Transformation is where subtle corruption occurs. Your logic must be brutally explicit.
- Null Handling: A `NULL` value is not zero. An SQL aggregation like `AVG()` treats them differently. Your transformation code must explicitly decide how to handle nulls. Do you cast them to zero? Do you filter out the entire row? Do you replace them with a forward-filled value from the previous record? Each choice has massive implications for the final report. Document this choice directly in the code.
- Timezone Conversion: This is a classic nightmare. The source system provides timestamps in UTC. The marketing team in New York wants to see daily aggregations in Eastern Time. Your transformation must correctly and consistently apply the timezone conversion. Storing all timestamps in the database as UTC and only converting them at the presentation layer is the only sane approach. Storing mixed timezones in a single table is asking for disaster.
- Data Enrichment Joins: When you join your ingested data with internal lookup tables (e.g., joining sales data with a user demographics table), what happens when there’s no match? The default `INNER JOIN` will silently drop records that don’t have a match in the demographics table. This could artificially deflate your total sales figures. You likely need a `LEFT JOIN` to keep all sales records and handle the null demographic fields explicitly.
Every transformation step is a potential data loss event. Log the record counts before and after each major step. If you start with 10,000 records from the raw layer and end up with 9,500 after a join, your logs must state that 500 records were dropped and why.
Stage 3: Presentation Layer Sanity Checks
The data has been ingested and transformed. Now it lands in a BI tool like Tableau or Power BI. The potential for misrepresentation here is huge, and it’s the last place you can catch an error before it gets to an executive.
Your dashboard is not just a visualization tool. It is the final quality gate. It must be built to expose data quality issues, not hide them. Every critical dashboard needs a dedicated “Data Quality” section, visible to all users.
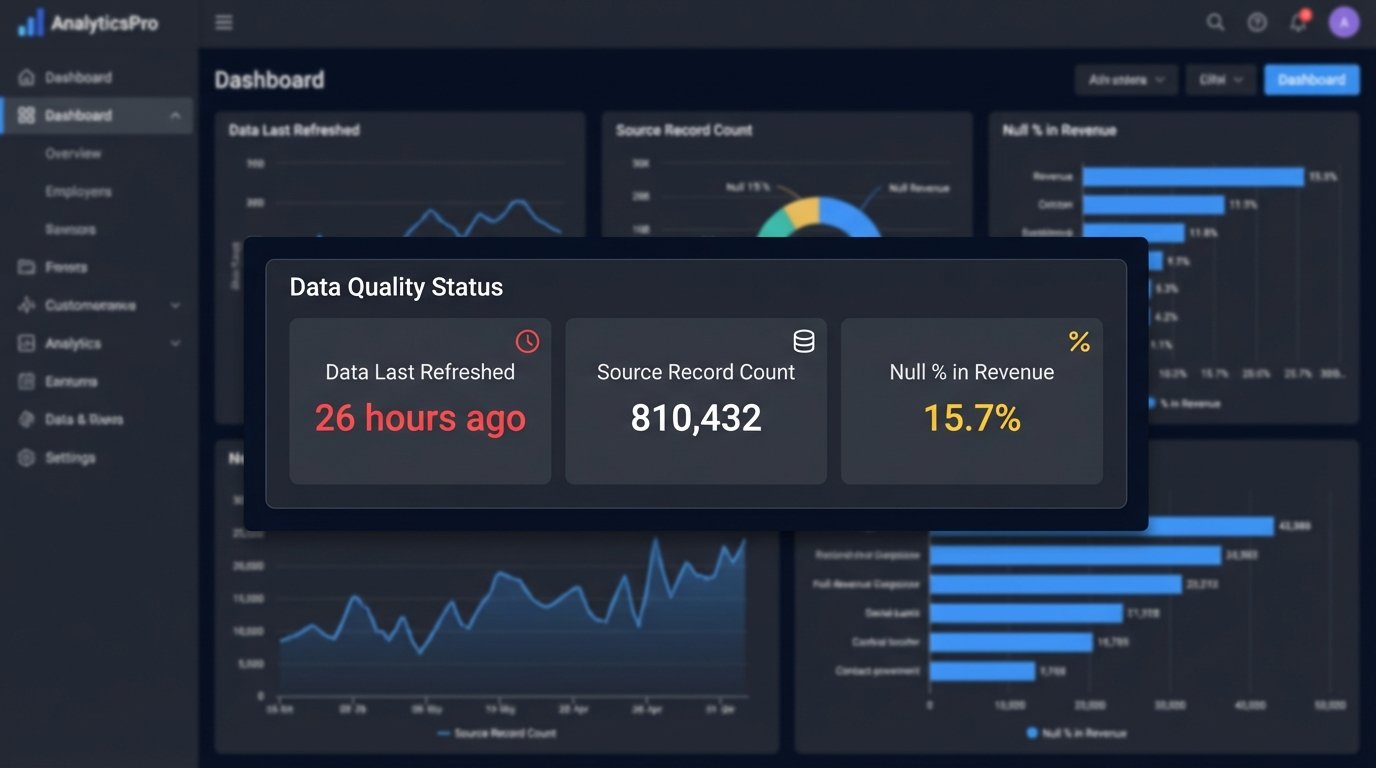
This section should include, at a minimum:
- “Data Last Refreshed” Timestamp: Not when the dashboard was opened, but the actual timestamp of the last successful data pipeline run. If this date is more than 24 hours old, it should be bright red.
- Source Record Count: A simple number showing the total records processed from the source in the last run. If this number deviates by more than a certain percentage (e.g., 20%) from the 7-day moving average, it’s a massive red flag. A sudden drop from 1 million daily events to 100,000 indicates a broken ingestion process.
- Null Percentage by Critical Field: Display the percentage of null values for key columns like `revenue`, `user_id`, or `transaction_id`. If `revenue` is suddenly 15% null when it’s normally 1%, something is broken upstream.
These are not “nice-to-have” features. They are non-negotiable components of a trustworthy report. Building a dashboard without them is like building a car without a fuel gauge or engine warning light. It runs, until it doesn’t.
Caching in BI tools is another silent killer. The dashboard might be showing you a perfectly cached, but now horribly outdated, version of the data. Force your BI tool to execute a live query for the data quality metrics every single time the dashboard is loaded. The performance hit is negligible compared to the cost of making a decision on stale data.
Finally, you need automated reconciliation. Your system should programmatically check totals against a known source of truth. For example, every day at 9 AM, an automated script should compare the `SUM(revenue)` in your reporting database for the previous day against the official sales number reported by the finance department’s system. If the numbers don’t match within a 1% tolerance, an alert is immediately sent to the data engineering team.
This is not about checking every single record. It’s about checking macro-level aggregates to catch systemic failures. This simple check would have instantly caught the `revenue_usd` field name change mentioned at the beginning.
Data quality is not a project. It’s a continuous, thankless, and absolutely critical process. The automation is the easy part. Building the validation, alerting, and reconciliation systems around that automation is the real work. Without it, your reports are just pretty pictures built on a foundation of sand.