
Case Study: Resuscitating Engagement with Data-Driven Newsletters
The problem was straightforward. Our client, a mid-sized B2B SaaS platform, was bleeding users. Their churn rate was climbing not because the product was bad, but because it was dense. Clients paid for ten features and used two. The marketing team’s solution was a weekly email blast full of generic success stories and blog links. Open rates were abysmal, and the click-through rate was a rounding error. It was digital noise, and it was getting ignored.
They weren’t solving the right problem. The issue wasn’t a lack of communication. It was a lack of relevant communication. We were tasked with building an automated system that did more than just announce features. It had to show clients how the product fit into *their* world, using *their* data. The goal was to build a newsletter that was impossible to ignore because it was about them.
The Diagnosis: Siloed Data and Irrelevant Content
A preliminary audit confirmed our suspicions. The client’s data architecture was a classic case of organic growth without a plan. Critical information was spread across three disconnected systems. The CRM held account-level details like subscription tier and company size. The product analytics platform tracked user-level events, showing which features were used and which were collecting dust. The support desk contained a goldmine of client pain points logged as tickets.
Each system was an island. The marketing team had no way to connect a user’s subscription level to their actual product behavior. They couldn’t target users who hadn’t adopted a key feature specific to their tier. This separation forced them to send the same generic message to a power user and a brand-new trial account. The result was predictable failure.
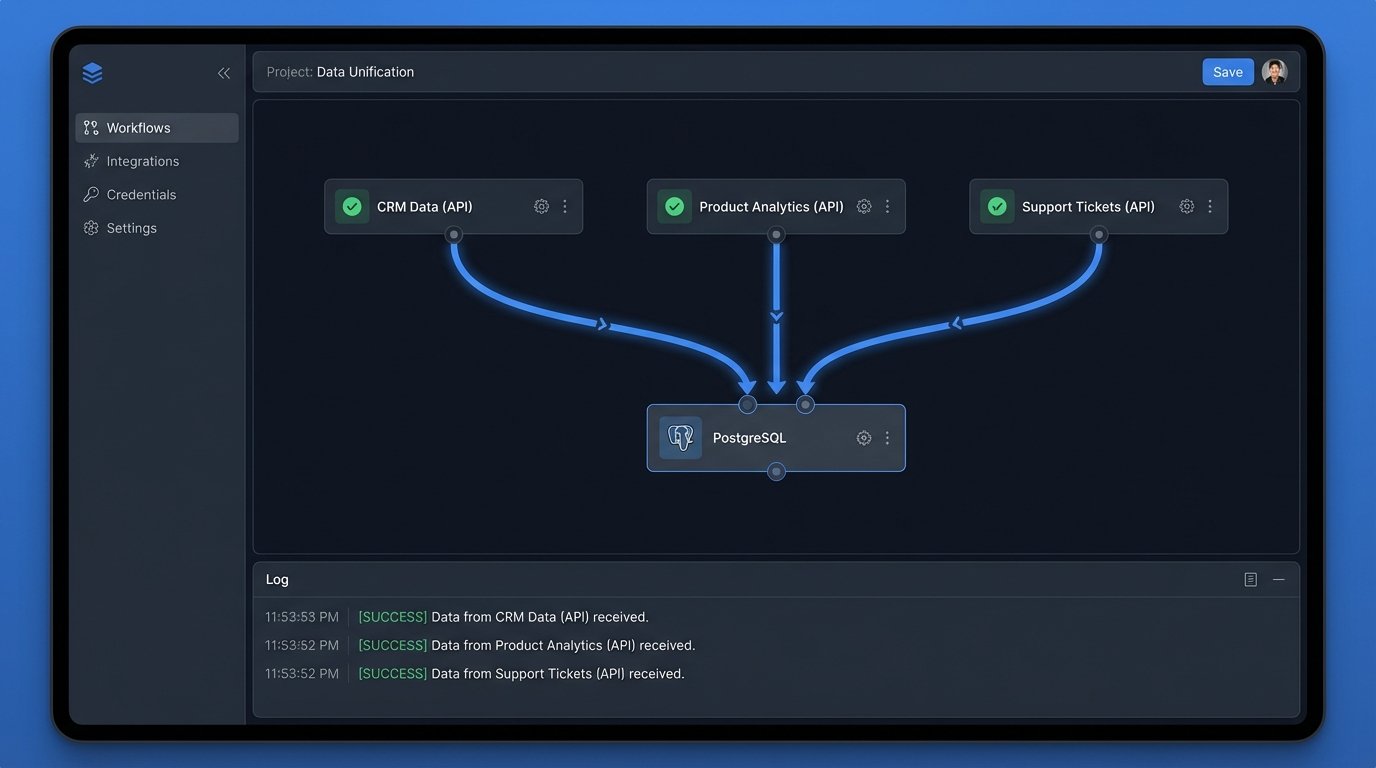
Our mandate was to bridge these islands. We needed to pull data from each source, stitch it together, and use the resulting profile to generate a personalized weekly digest for each client account. This wasn’t a marketing project. It was a data engineering problem with an email frontend.
Architecture of the Solution: A Three-Layer Stack
We broke the system down into three logical components: data ingestion, data processing, and content generation. We deliberately avoided heavy enterprise tools. The entire stack was built with Python scripts, a PostgreSQL database, and a transactional email API. This approach kept costs down and gave us granular control over the logic, which was critical for debugging.
1. The Ingestion Layer: API Wrangling
The first step was to get the data out. We wrote three separate Python collectors, one for each source API. This wasn’t a simple data dump. Each API had its own authentication method, rate limits, and pagination quirks. The product analytics API was particularly troublesome, as pulling event-level data for thousands of users was a quick way to get temporarily banned. We had to build in logic to request only delta changes since the last run, not the full history.
We stripped the raw JSON responses down to the bare essentials on the fly. We didn’t need every field. From the CRM, we needed `account_id`, `subscription_tier`, and `renewal_date`. From product analytics, we needed `user_id`, `event_name`, and `event_timestamp`. From the support desk, it was `account_id` and `ticket_count_last_30d`. Storing this lean data kept the database footprint small and the processing jobs fast.
Trying to correlate this data without a universal identifier was the first major hurdle. The CRM used an `account_id`, but the analytics platform was keyed on `user_id`. We had to build a mapping table to connect individual user actions to the parent company account. This process felt like trying to assemble furniture from two different companies with two different sets of instructions. Nothing lined up without forcing it.
2. The Processing Layer: Forging a Single Source of Truth
With the raw data flowing into separate tables in our PostgreSQL instance, the real work began. A nightly cron job executed a series of SQL queries to transform and aggregate the information. This is where the business logic lived. We calculated metrics like “most used feature this month,” “unused features in current subscription tier,” and “change in weekly active users.”
A key calculation was comparing a client’s usage against an anonymized cohort. For example, we could determine if a client’s usage of a specific reporting feature was in the top 10% or bottom 10% of all clients in their industry and subscription tier. This provided a powerful benchmark that turned a simple statistic into a competitive insight.
This processing stage was intentionally monolithic. A single, large SQL script handled all the logic. While this might offend some microservice purists, it made debugging a nightmare scenario much simpler. We could run the entire transformation in a staging environment and see the exact state of the data at each step. No chasing logs across five different services.
3. The Generation and Dispatch Layer: Dynamic Content Injection
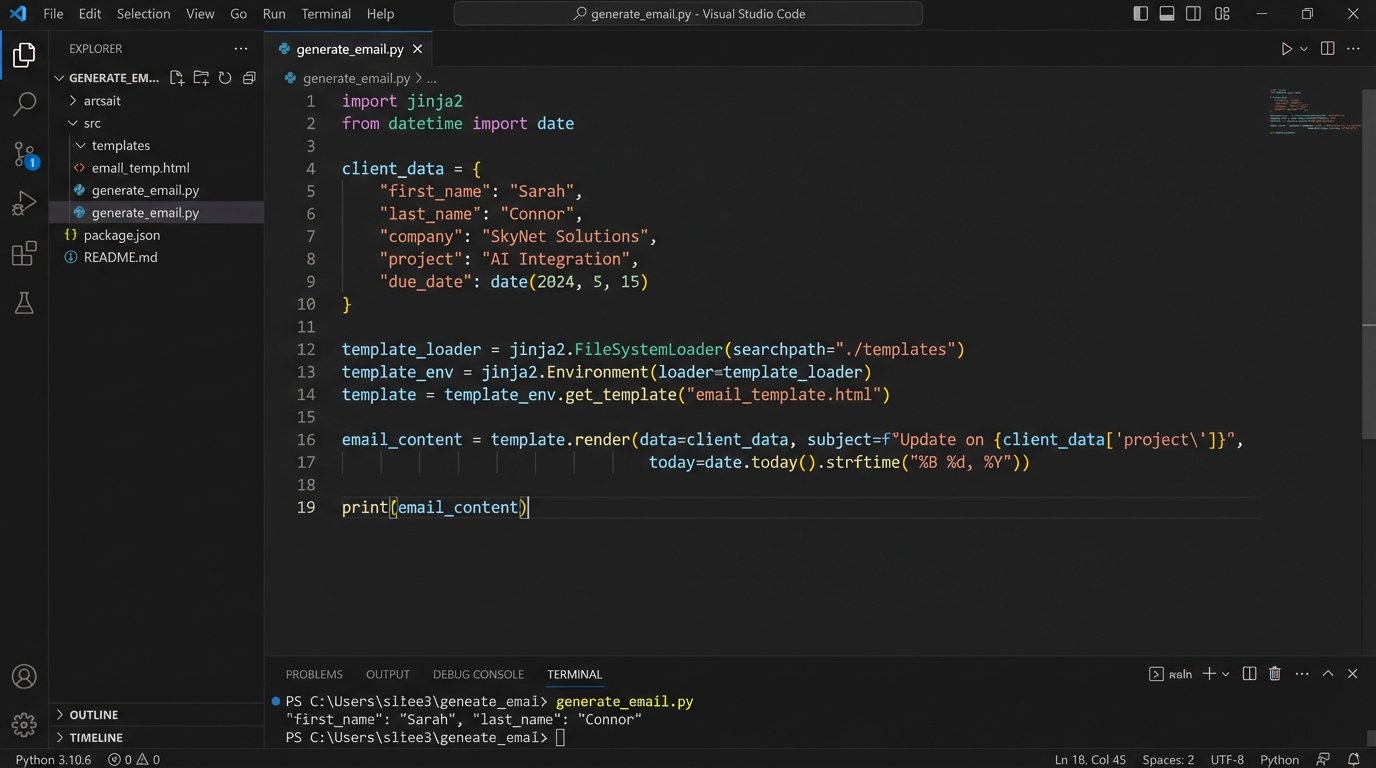
The final piece was generating the HTML email. We refused to use a drag-and-drop marketing editor. Those tools are built for static content and produce bloated, unreliable code. We opted for the Jinja2 templating engine within a Python script. This gave us programmatic control over the email’s structure.
The template was a skeleton with conditional blocks. Based on the data processed in the previous step, the script would inject personalized stats and dynamically include or exclude entire sections. A client with low adoption of a key feature would see a block with a link to a tutorial. A power user would see a section highlighting an advanced, underused API endpoint. No two clients received the exact same email.
Here’s a simplified look at a Jinja2 snippet that handles this logic:
<h3>Your Weekly Performance Snapshot</h3>

<p>You had {{ active_users }} active users this week, a {{ user_change_percent }}% change from last week.</p>

<p>Your most used feature was '{{ most_used_feature }}'.</p>
{% if unused_key_feature %}
<div class="callout">
<h4>Unlock More Value</h4>
<p>Did you know the '{{ unused_key_feature.name }}' feature is included in your plan?
Clients like you see an average 15% increase in efficiency after adopting it.
<a href="{{ unused_key_feature.tutorial_link }}">Learn how to get started.</a></p>
</div>
{% endif %}
This logic check is simple but effective. It turns the newsletter from a passive announcement into an active, consultative tool.
For delivery, we piped the rendered HTML to a transactional email service API. These services are built for high-deliverability, one-to-one communication, and their APIs are clean and reliable. Using a bulk marketing platform for this would have been a mistake. Their infrastructure is optimized for massive, identical sends, not thousands of unique ones, and they are more likely to be flagged as spam.
The Results: Quantifiable Impact on Core Metrics
The system was not an overnight success. The first few sends revealed edge cases in our data logic and formatting bugs in obscure email clients. But after a month of stabilization, the numbers started to speak for themselves. We tracked the results against the old marketing emails and the difference was stark.
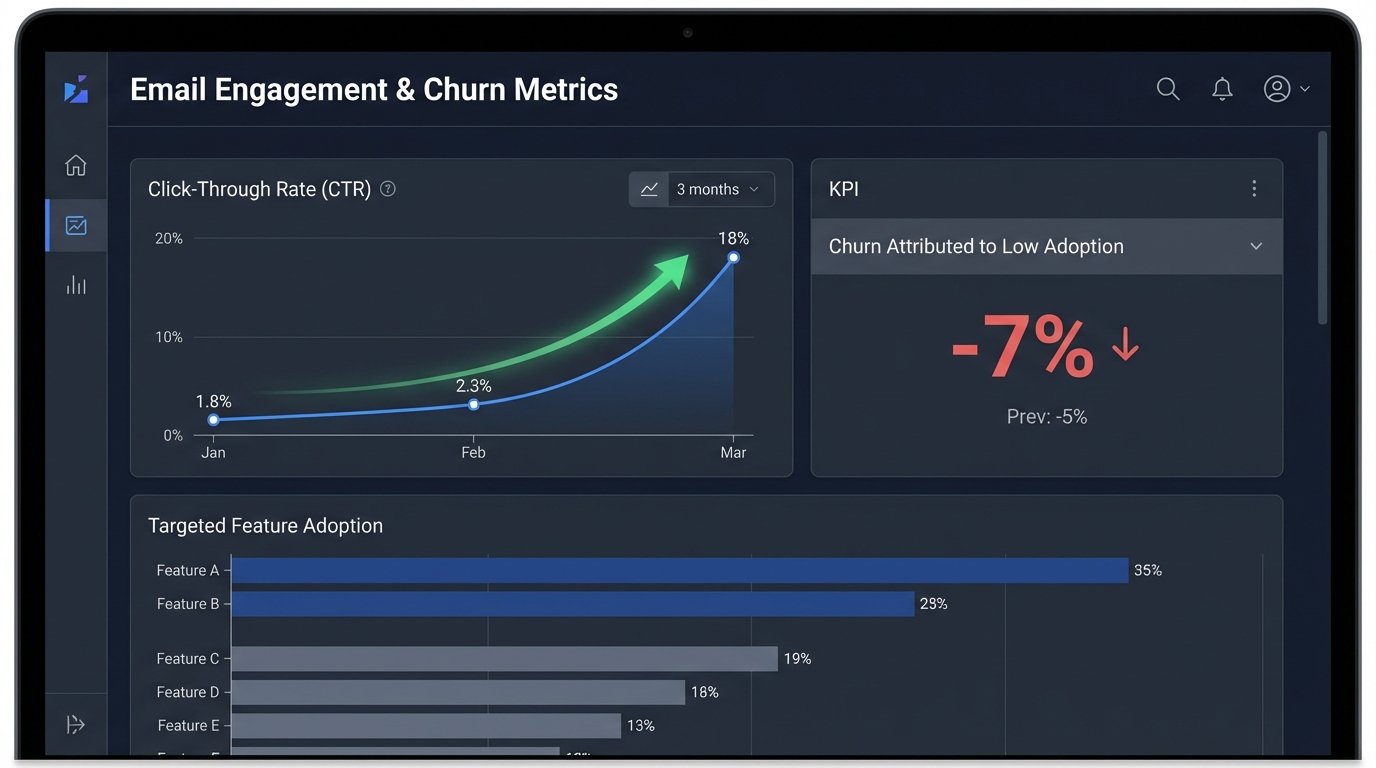
- Click-Through Rate (CTR): The old, generic newsletter averaged a 1.8% CTR. The new, personalized digest immediately jumped to 11% on its first send and stabilized at an average of 18% over the next quarter. Users were clicking because the links were directly relevant to their own account.
- Feature Adoption: We tracked the adoption of specific features mentioned in the “unused feature” block. Within 90 days of receiving a targeted mention, an average of 35% of accounts had activated that feature. This was a direct line from our email to product engagement.
- Support Ticket Volume: An unexpected benefit was a reduction in “how-to” support tickets. By preemptively educating users on features relevant to them, we saw a 12% drop in low-level support queries, freeing up the support team to handle more complex issues.
- Account Churn: The ultimate metric. Over the six months following the system’s launch, churn attributed to “low product adoption” or “lack of perceived value” decreased by 7%. This translated directly to retained revenue.
The project’s success came from a fundamental shift in thinking. We stopped blasting information and started delivering intelligence. By treating client communication as a data problem, we built a system that strengthened the client relationship with every send. It demonstrated that we understood their needs because we were paying attention to their actions. It was more than a newsletter. It was a weekly, automated consultation.