The Monday Morning Data Fire Drill
The problem wasn’t a lack of data. The problem was a weekly, manual ritual of data torture. Every Monday, a senior analyst was sacrificed for four hours to the gods of Salesforce reporting. They would log in, navigate through a swamp of saved reports, export multiple CSVs, and then attempt to stitch them together in Excel. The result was a report that was always late and never consistent.
Leadership meetings would derail into arguments about whose numbers were correct. The sales team in the East region saw different “New Opportunity” counts than the analyst’s final report. This wasn’t a data problem. It was a process failure generating data friction, burning cash on analyst hours that produced arguments instead of insights.
Pinpointing the Technical Failures
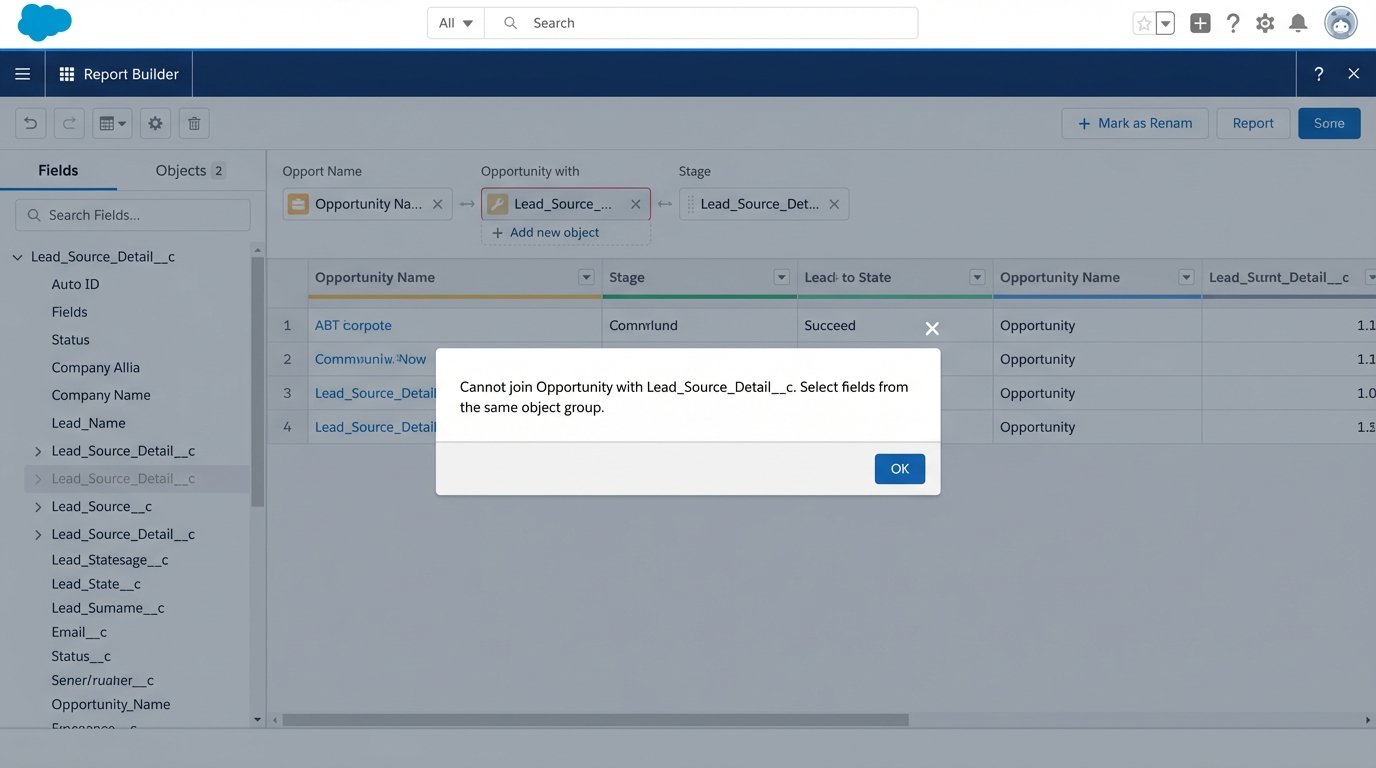
The root cause was buried in the CRM’s architecture. Standard Salesforce reporting couldn’t join the standard `Opportunity` object with a custom `Lead_Source_Detail__c` object in the way management wanted. They needed to see pipeline generated from a specific marketing campaign attribute stored in that custom object. The native tools were insufficient for the business logic required.
A ticket was filed with the BI team for a proper data warehouse integration. The ETA was six months. The business couldn’t wait that long for a report they considered mission-critical. The mandate was clear: deliver a consolidated PDF report to all regional VPs every Monday at 8 AM sharp. No more spreadsheets. No more manual pulls.
Architecture of the Solution: Serverless and Brutally Direct
We bypassed the BI queue entirely. The chosen architecture was a serverless Python script running on AWS Lambda, triggered by a schedule. This approach minimized infrastructure overhead and kept the cost pinned directly to execution time. It’s a scalpel, not a sledgehammer.
The entire workflow was designed to be a straight line from data source to inbox, with three distinct operational stages: extraction, transformation, and delivery.
Stage 1: Data Extraction via API
We targeted the Salesforce REST API directly using the `simple-salesforce` Python library. Authenticating with a dedicated integration user, we executed targeted SOQL queries to pull raw data from the necessary objects. Relying on the API instead of a third-party connector eliminated another vendor contract and potential point of failure. The goal was to own the entire data pipeline.
The initial attempts to pull all the weekly data in one massive query immediately hit Salesforce governor limits. The API isn’t an open fire hydrant. Trying to pull a year’s worth of opportunity data for trend analysis was like shoving a firehose through a needle. The API throttled the connection, and the script timed out.
The fix was to break the queries into smaller, logical chunks. We pulled leads, then opportunities, then the custom object data in separate calls. We also implemented logic to pull data incrementally based on the `LastModifiedDate`, reducing the payload size for each run after the initial backfill. This requires careful state management, but it keeps the script running under the API’s radar.
A typical query looked like this, pulling just the essentials to keep the payload lean.
# Minimal SOQL query to fetch recent Opportunity data
soql_query = """
    SELECT
        Id,
        Name,
        Amount,
        StageName,
        CloseDate,
        CreatedDate,
        Account.Name,
        LeadSource,
        Lead_Source_Detail__c
    FROM Opportunity
    WHERE CALENDAR_YEAR(CreatedDate) = 2023
    AND Amount != NULL
"""
This approach gives you surgical control over the data you extract. It’s more work than a drag-and-drop ETL tool, but you’re not locked into a vendor’s interpretation of your schema.
Stage 2: In-Memory Transformation with Pandas
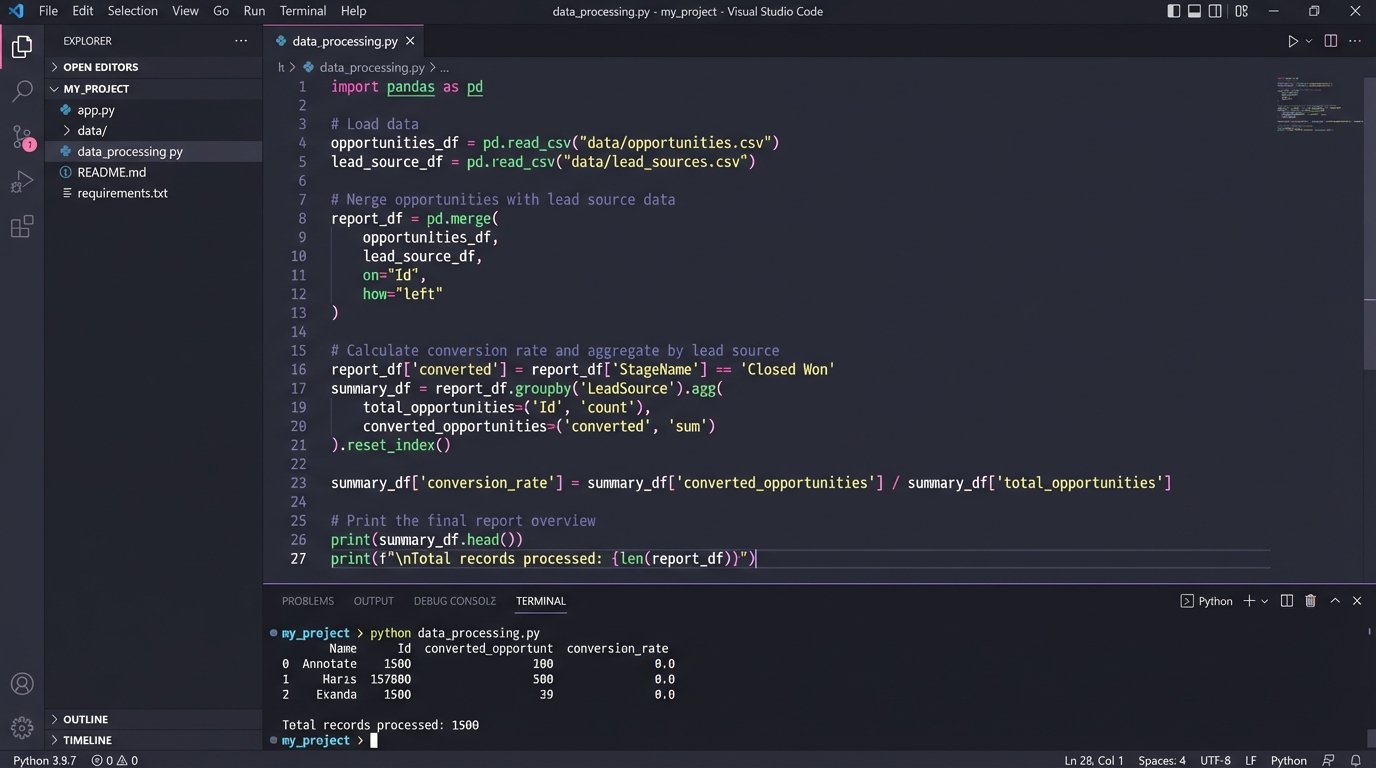
The JSON responses from the Salesforce API are not report-ready. They are collections of raw records. We used the Pandas library within the Lambda function to force this raw data into a structured format. Each API response was loaded into a separate DataFrame.
This is where the real logic lives. We performed the equivalent of a SQL JOIN between the opportunity data and the custom object data directly in memory. We calculated new fields, like `Time_to_Close_Days`, by subtracting `CreatedDate` from `CloseDate`. We aggregated totals, grouped by sales region, and pivoted the data to match the exact layout requested by the stakeholders. This in-memory processing is incredibly fast for the dataset size we were handling, typically under 50,000 records per week.
The key here is that the Lambda’s ephemeral nature is a feature. It spins up, performs the transformation on a clean slate, and spins down. There’s no risk of data pollution from a previous run. The entire environment is stateless and predictable.
Stage 3: PDF Generation and Delivery
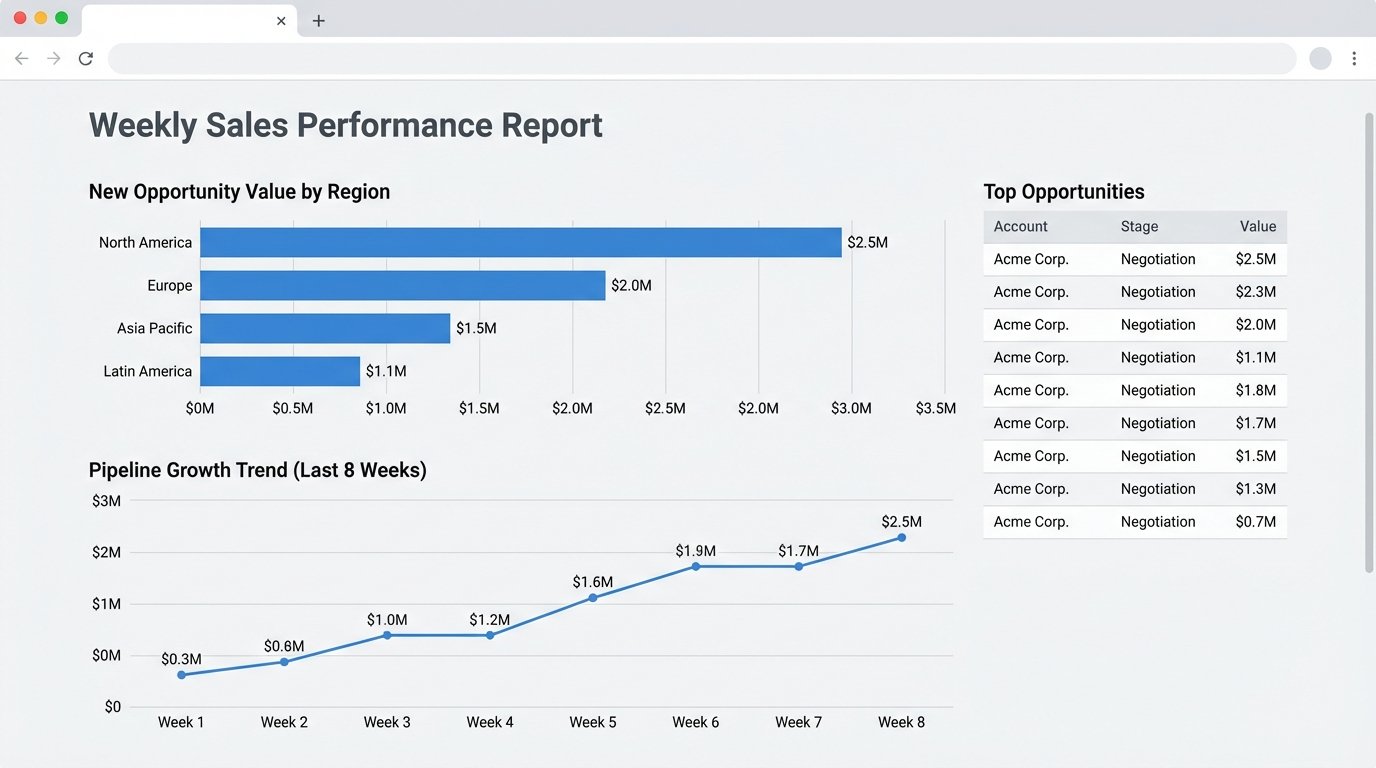
Stakeholders wanted a PDF, a format notoriously hostile to programmatic generation. We used the `Matplotlib` library to generate the required charts, bar graphs for regional performance, and line charts for weekly trends. These charts were saved as image buffers in memory.
To assemble the final document, we used the `FPDF2` library. It’s a low-level tool that lets you place text, tables, and images at specific coordinates on a page. It’s tedious but offers absolute control over the final output. The Pandas DataFrames containing the aggregated numbers were converted into tables, and the Matplotlib image buffers were injected directly into the PDF structure. The final PDF file was assembled entirely in the Lambda’s `/tmp` directory.
For delivery, the script connected to Amazon Simple Email Service (SES). Using the `boto3` library, we constructed a MIME message, attached the newly generated PDF, and sent it to a predefined distribution list. The whole process, from trigger to email delivery, took about 75 seconds.
Orchestration and Error Handling
The automation is orchestrated by Amazon EventBridge, which triggers the Lambda function on a simple CRON schedule: `cron(0 8 ? * MON *)`. Every Monday at 8:00 AM UTC, the process kicks off.
A successful automation is one that screams when it breaks. We wrapped the main execution logic in a `try…except` block. Any failure, whether an API connection error, a data transformation bug, or an SES permission issue, triggers an alert. The exception details are logged to CloudWatch and a notification is pushed to a dedicated Slack channel via a webhook. The operations team knows within seconds if the report failed to generate, long before stakeholders start asking where it is.
Quantifiable Results and Lessons Learned
The impact was immediate and measurable. The project moved from concept to production in three weeks. The results were not just about efficiency. They were about building trust in the data.
Key Performance Indicators
- Manual Labor Reduction: We eliminated 4 hours of manual work per week for a senior data analyst. Annually, this reclaimed over 200 hours of high-skill labor that was being wasted on copy-paste tasks. The hard cost savings were roughly $15,000 per year, based on the analyst’s loaded cost.
- Data Consistency: Achieved 100% consistency in reporting. The weekly meeting arguments about data sources stopped. The report became the single source of truth for weekly performance, allowing leadership to focus on strategy, not data validation.
- Timeliness: Reports are now delivered automatically at 8:00 AM, compared to the previous average of 11:00 AM. This gives the leadership team time to review the data before their morning meetings.
The Inevitable Scope Creep
The automation worked too well. Within a month, the requests started. “Can we get this daily?” “Can we add three more charts?” “Can you segment this by individual sales rep?” Each request seemed small, but collectively they threatened to turn a lean script into a bloated monolith.
This is the primary risk of successful tactical automation. It solves a problem so effectively that it becomes the default tool for every adjacent problem. We had to establish a rigid change-request process. New metrics or segments required a formal justification and were batched for quarterly updates, preventing the script from becoming an unmaintainable mess of special cases.
Maintenance is Not Optional
This system is not “set it and forget it.” It requires monitoring. About two months after launch, the script started failing intermittently. The cause was a change in the Salesforce org. A sales ops team member had changed the API name of a picklist value in the `StageName` field. The Python script, expecting the old value, threw a `KeyError` during the data transformation stage.
The failure highlighted the brittle nature of code that depends on an external system’s schema. The fix involved adding a validation layer to the script that checks for expected values and fields. If an unexpected value appears, it logs a warning and excludes it from the report instead of crashing the entire process. The automation must be resilient to upstream changes, because upstream changes are guaranteed.
This solution was a tactical win. It solved a specific, costly problem quickly and cheaply. It’s not a replacement for a proper BI infrastructure, but it bridged a critical gap and delivered immediate value, proving that targeted, serverless automation can punch far above its weight class.