The Problem: Attribution by Gut Feel
The client’s marketing department was operating on spreadsheets and institutional memory. Every month, an analyst would manually pull CSVs from Google Ads, Facebook Ads, LinkedIn, and Google Analytics. They would then try to stitch this data together with a Salesforce export to figure out what was working. The process took 40 hours a month and the result was a report that was outdated the moment it was finished.
Attribution was a joke. A lead in Salesforce might have come from a Google ad, but without consistent UTM tracking and a system to join the datasets, it was a guess. The team was spending over $150,000 a month with no reliable way to connect that spend to closed-won revenue. They were essentially just setting fire to a pile of money and hoping a customer would walk out of the smoke.
The Initial Diagnosis: A Disconnected Mess
The core failure wasn’t marketing strategy. It was a complete lack of a data pipeline. Each platform was a silo, speaking its own language with its own metrics. The first step was not to build dashboards, but to architect a central nervous system for their data. We had to gut the manual process entirely.
The proposed stack was designed for pragmatism, not for chasing the newest tech. We opted for Google BigQuery as the data warehouse because the client was already on GCP. Python scripts, orchestrated by Apache Airflow, would handle the ingestion and transformation. For the final presentation layer, we chose Looker because of its strong data modeling capabilities via LookML, which prevents analysts from running wild with inconsistent metric definitions.
This wasn’t a plug-and-play solution. The goal was to force every piece of marketing data into a single, unified schema. This is the part that everyone underestimates. It means writing logic to handle API changes, mapping differently named fields that mean the same thing, and standardizing data types across sources. It is tedious, unglamorous, and absolutely critical.
Data Ingestion: Bridging the API Gaps
We built individual Python extractors for each data source. The Google Ads API was the first target. We used its client library to pull campaign, ad group, and ad-level performance data daily. The main challenge was rate limiting and the query complexity of the Google Ads Query Language. You can’t just ask for everything. You have to be specific and handle pagination correctly to avoid getting timed out.
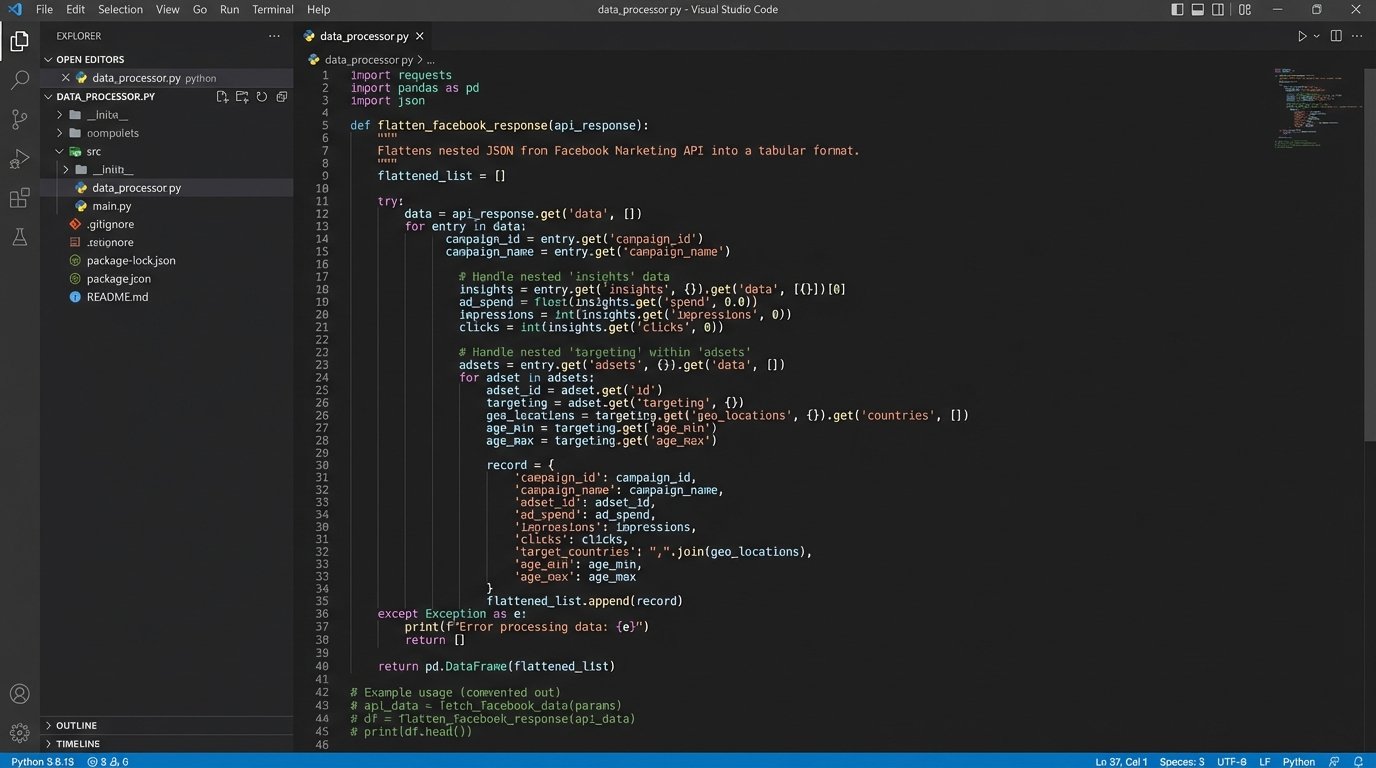
Facebook’s Marketing API was a different beast. Authentication is handled via OAuth, which requires a token management system to refresh credentials. We built a small service to handle this exchange. The API’s response structure is also heavily nested, requiring us to write functions to flatten the JSON objects into a table-friendly format before loading them into BigQuery. Stitching together these APIs was like trying to wire a modern server with tools from three different decades.
Salesforce was the final, critical piece. We used the Simple Salesforce Python library to query the REST API for Lead, Opportunity, and Account objects. The key was to pull not just the current state but also historical changes using the `get_updated()` method. This allowed us to track how a lead progressed through the funnel over time, not just where it ended up. This historical view is vital for calculating sales cycle velocity.
A sample snippet shows the logic needed just for handling pagination in a generic API call. It’s boilerplate, but it’s boilerplate that breaks everything if you get it wrong.
def fetch_paginated_data(api_endpoint, headers):

    all_results = []

    next_page_url = api_endpoint
while next_page_url:
try:
response = requests.get(next_page_url, headers=headers)
response.raise_for_status() # Logic-check for HTTP errors
data = response.json()
all_results.extend(data.get('results', []))
next_page_url = data.get('pagination', {}).get('next_page')
# Defensive delay to respect rate limits
time.sleep(1)
except requests.exceptions.HTTPError as e:
print(f"HTTP Error: {e}")
break
except requests.exceptions.RequestException as e:
print(f"Request failed: {e}")
break
return all_results
This is the ground-level work required before you can even think about ROI.
Transformation and Modeling: Forcing Data into Submission
Once the raw data landed in BigQuery, the real work started. We used dbt (Data Build Tool) to manage our SQL-based transformations. This provided version control, testing, and dependency management for our data models, which is something you don’t get by just chaining SQL scripts together in an orchestrator.
The first transformation layer focused on cleansing. This involved things like:
- Campaign Name Normalization: Stripping whitespace and converting all campaign names to a consistent format (e.g., `q4_2023_brand_awareness_linkedin`) using regex. Inconsistent naming conventions are the silent killer of marketing analytics.
- Bot Filtering: Applying basic filters to Google Analytics data to remove sessions with 100% bounce rates and sub-1-second duration. It’s not perfect, but it removes the most obvious noise.
- Currency Conversion: Standardizing all spend data to USD, as some smaller campaigns were run in different currencies.
The second, more complex layer was attribution modeling. We created a sessionization model that stitched together user interactions based on a client ID from Google Analytics. We then joined this clickstream data with ad platform data using UTM parameters as the primary key. If a `utm_campaign` value from a Google Analytics session matched a campaign name from the Google Ads data, we could link them.
This allowed us to build a last-touch attribution model in SQL. We identified the last known marketing touchpoint before a lead was created in Salesforce. This model gave the marketing team their first reliable view of which channels were actually generating leads, not just clicks. It wasn’t perfect, but it was infinitely better than guessing.
The BI Layer: From Data to Decisions
With a clean, modeled data warehouse, the Looker implementation was straightforward. We built three core dashboards to replace the monthly spreadsheet nightmare.
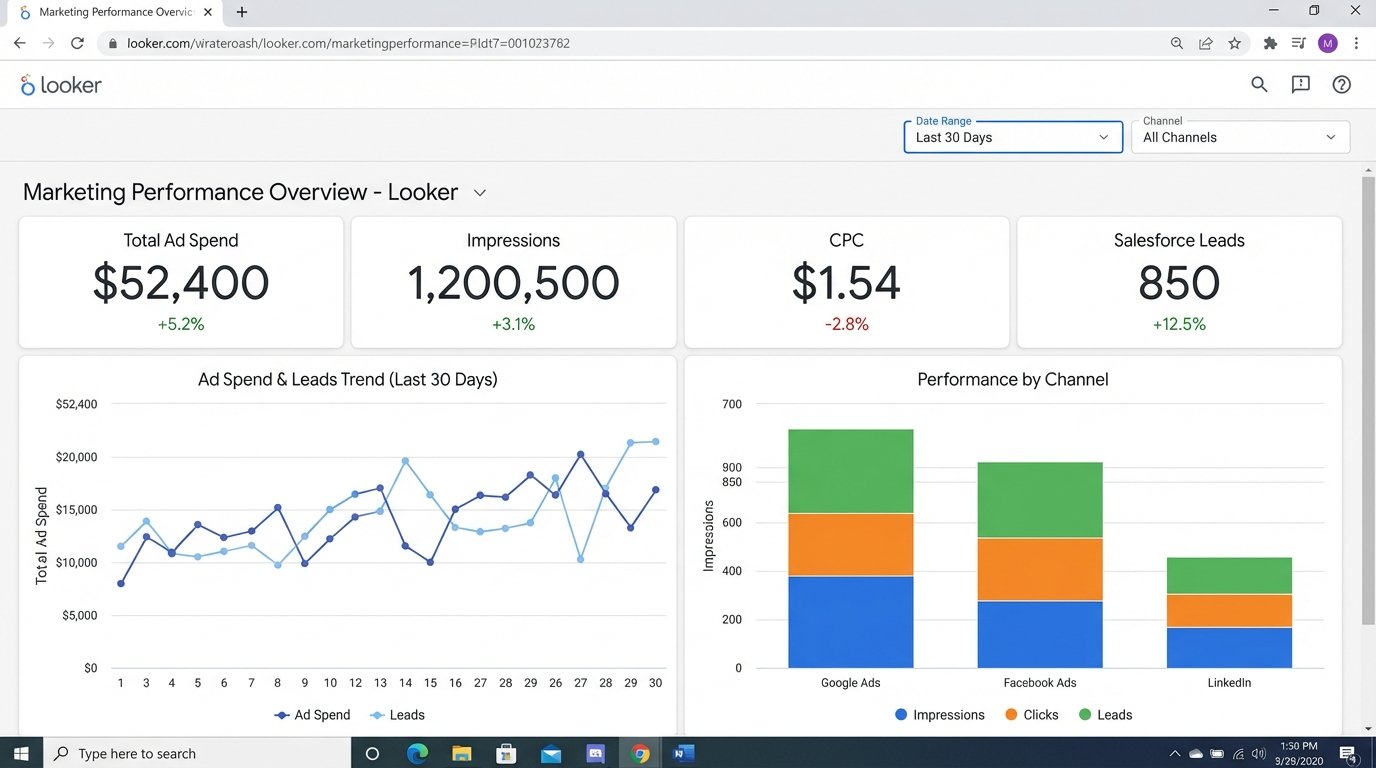
Dashboard 1: The Performance Overview. This was the top-level view. It showed total spend, impressions, clicks, cost-per-click (CPC), and conversions (defined as Salesforce lead creations) across all channels. Users could filter by date range, channel, and campaign. For the first time, the CMO could see Google, Facebook, and LinkedIn performance on a single screen, with metrics calculated the exact same way for each.
Dashboard 2: The Funnel Analysis. This dashboard connected the marketing data to the sales data. It visualized the entire funnel from ad impression to closed-won deal. Key metrics included Lead-to-MQL conversion rate, MQL-to-SQL rate, and the overall win rate, all sliceable by marketing channel. This immediately highlighted a major problem: LinkedIn campaigns were generating a high volume of MQLs, but their win rate was near zero. They were quality leads on paper, but they never converted to revenue.
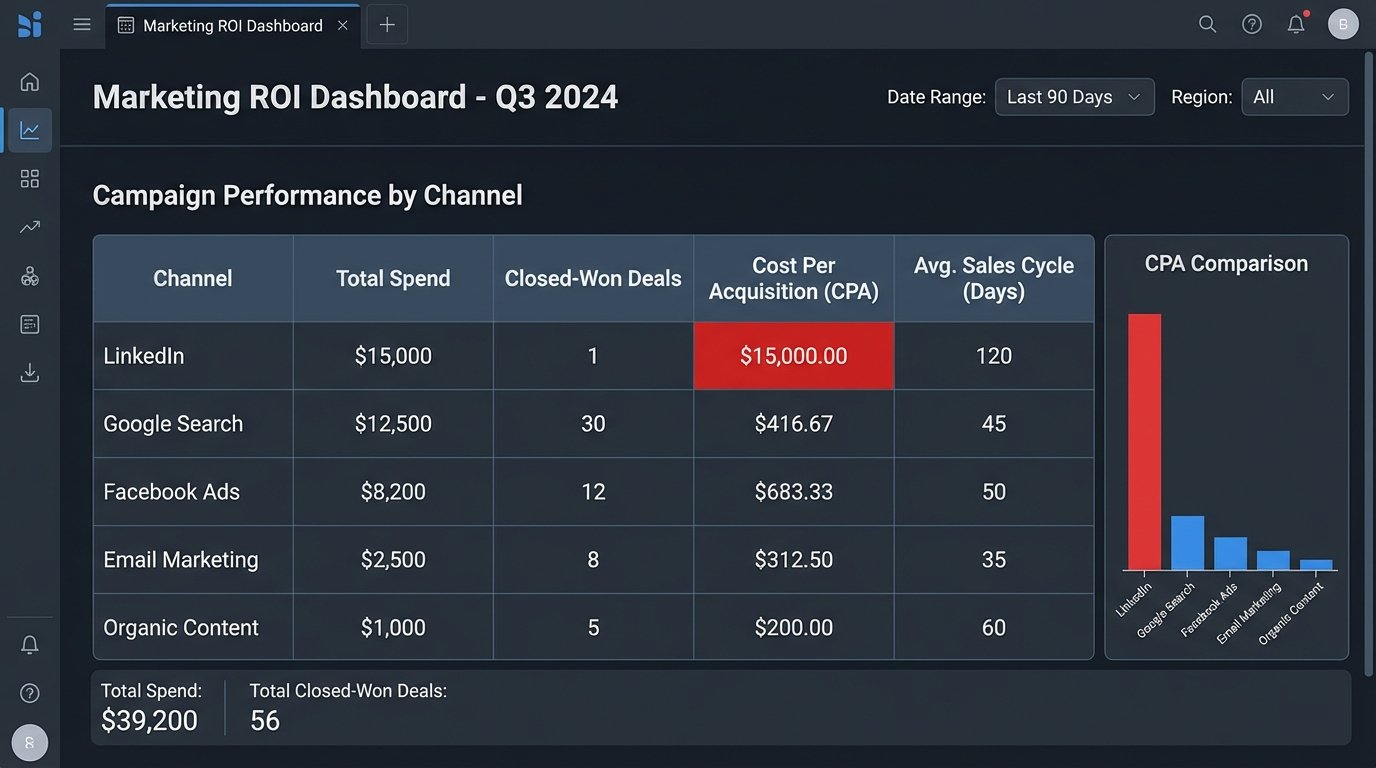
Dashboard 3: ROI and Sales Velocity. This was the final objective. It calculated Cost Per Acquisition (CPA) by dividing the spend on a specific channel by the number of closed-won deals attributed to it. It also calculated the average time in days from first touch to deal close. This exposed which channels brought in not just cheap leads, but profitable customers, fast.
Activation: From Passive Reports to Active Monitoring
A dashboard is useless if no one looks at it. We implemented an alerting system directly from the data warehouse. We wrote SQL-based jobs in Airflow that ran daily to check for anomalies. If the CPA for a major campaign jumped by more than 25% week-over-week, an alert was automatically sent to the marketing team’s Slack channel. This shifted the team from reactive analysis to proactive management.
The Results: A 28% Reduction in Wasted Ad Spend
The numbers speak for themselves. Within three months of the system going live, the impact was clear.
The funnel analysis dashboard revealed the LinkedIn campaign problem. The campaign was generating leads that looked great to the marketing team but were being consistently rejected by sales. It was costing them $15,000 a month. They paused the campaign and reallocated the budget to a Google search campaign that had a higher initial CPL but a 10x higher final win rate. This single change saved them $180,000 annually.
Overall, by systematically identifying and defunding underperforming campaigns and doubling down on proven winners, the client reduced their blended CPA by 28%. Marketing-attributed revenue increased by 19% in the following six months, all without increasing their total ad budget. The 40 hours per month of manual reporting were also completely eliminated, freeing up an analyst to work on strategy instead of data entry.
The project cost was not trivial. It involved engineer-weeks for the pipeline construction and ongoing costs for the cloud services and BI licenses. However, the ROI was achieved in under five months. The cost of building the system was dwarfed by the cost of continuing to operate in the dark.
Final Learnings
This kind of project is more about process than technology. The hardest part was getting marketing and sales to agree on a concrete, universal definition for a “Marketing Qualified Lead.” Without that agreement, the entire data model is built on sand.
Discipline is also non-negotiable. The system depends on consistent UTM tagging for all campaigns. We had to build a simple tool to generate tagged URLs for the marketing team to enforce this. One untagged campaign can punch a hole in the entire attribution model.
An automated BI system is not a project you finish. It’s a product you maintain. APIs will change, new marketing channels will be added, and business goals will shift. The system needs a dedicated owner to keep it running and adapt it. Clean, reliable, and properly modeled data is the foundation of any intelligent marketing operation. Everything else is just expensive guesswork.