
Stop Asking for Tech. Start Proving Its Necessity.
Agency leadership doesn’t approve tech budgets based on “potential” or “efficiency gains.” They approve them to stop a quantifiable bleed. Your job isn’t to sell a vision. It’s to present a ledger of existing financial waste and offer the only logical way to patch the hole. Most pitches fail because they start with the solution. We will start with the pain, measured in dollars and wasted hours.
The conversation changes when you stop saying, “This tool will make us faster,” and start showing, “We are currently burning $75,000 a year on manual data entry for Tier 1 clients.” One is a hopeful projection. The other is an active fire that demands a response. This is not about persuasion. This is about diagnostics.
Step 1: Quantify the Manual Labor Tax
Before you even think about a tool, you need indisputable data on the problem. Finance departments think in numbers, so you must provide them. The first target is any repetitive, multi-step process that a human is forced to execute. Think weekly client reporting, keyword rank checks across multiple domains, or staging site deployments. Your goal is to attach a price tag to this friction.
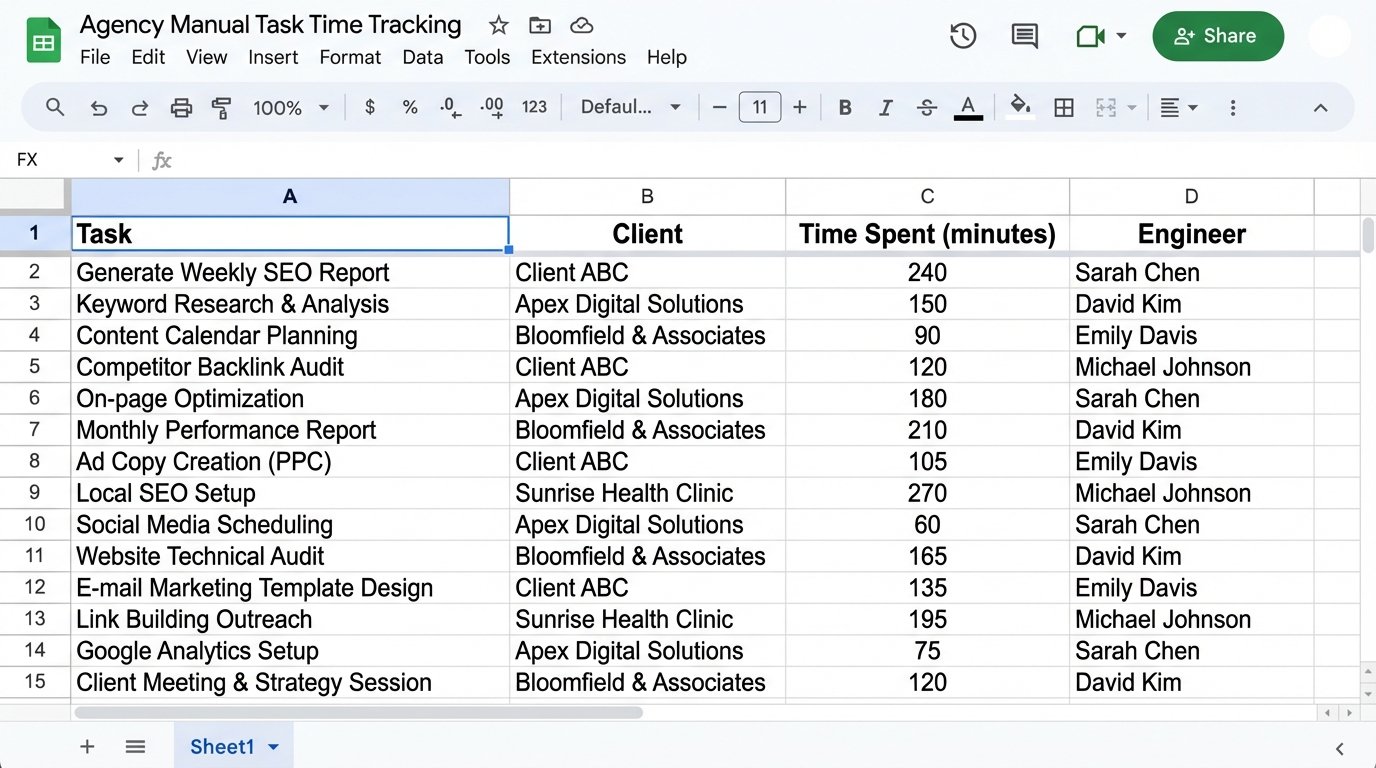
Start logging hours. Force your team to track time spent on specific automatable tasks for two weeks. If you don’t have a system, a shared Google Sheet will do. You need columns for Task, Client, Time Spent (in minutes), and Engineer. This isn’t micromanagement. It’s ammunition.
After two weeks, you aggregate the data. You aren’t looking for averages. You’re looking for the total sum of wasted time. Calculate the “Manual Labor Tax” by multiplying the total hours by a blended hourly rate for the staff involved. This number is the foundation of your entire argument. Without it, you have nothing but an opinion.
This is the metric that gets attention, not the feature list of some new platform.
Step 2: Isolate the Specific Bottleneck
A vague request for a “reporting automation platform” is easy to deny. It’s a blank check. Instead, you must pinpoint the exact technical constraint that causes the manual labor you just quantified. Are you hitting API rate limits? Is data transformation between systems the time sink? Is the local machine running the script too sluggish to process the required data volume?
Be brutally specific. For instance, the problem is not “reporting is slow.” The problem is “pulling data from the Google Ads API, the Facebook Marketing API, and our internal sales database, then merging them in Excel takes one analyst 8 hours per client, per month.” Naming the specific APIs and the manual merge point turns an abstract complaint into a solvable engineering problem.
This diagnosis dictates your proposed solution. If the bottleneck is API orchestration, you might look at a data integration tool. If it’s data processing, you might need budget for a cloud-based virtual machine or a database to stage the data. Proposing a targeted fix for a diagnosed problem shows you’ve done the work and aren’t just chasing a new shiny object.
Treating every manual report pull as a fresh task is like recompiling your entire codebase for every minor variable change. It is calculated insanity driven by a refusal to invest in proper tooling.
Step 3: Build a Low-Fidelity Proof of Concept (PoC)
Never walk into a budget meeting with a sales deck. Walk in with a working demo. The goal of the PoC is to build an undeniable demonstration of the automated future on the smallest possible scale. Use free tiers, developer accounts, and any scrap of internal resources you can find. Your objective is to de-risk the investment for decision-makers by proving the concept works before any significant money is spent.
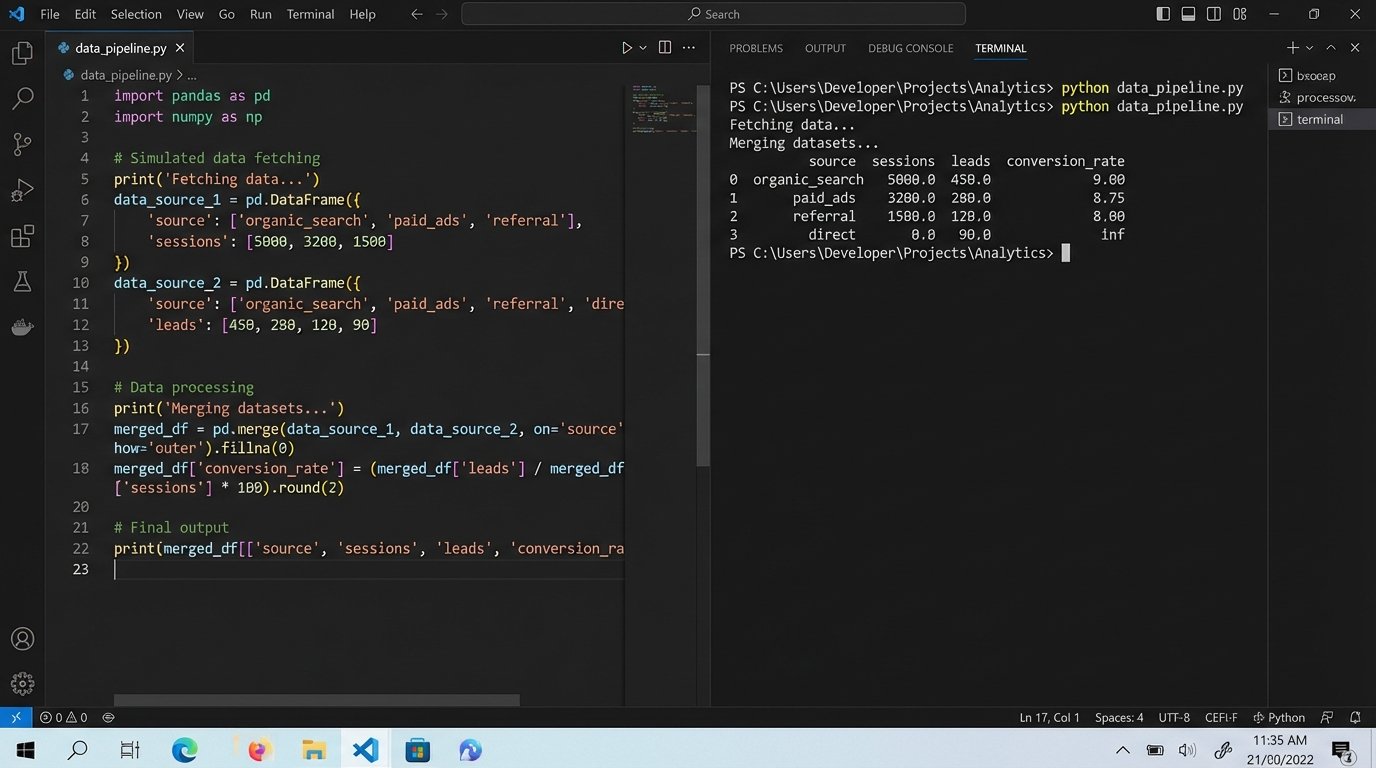
Select one client and one specific report you quantified in Step 1. Build the automated workflow for just that single use case. This might be a Python script that hits a few APIs, dumps the data into a Pandas DataFrame, performs a basic merge, and exports it to a Google Sheet. It doesn’t need a UI or flawless error handling. It just needs to work, once, and prove the core logic is sound.
This script becomes your primary leverage. You can now show the “before” (the time log showing 4 hours of manual work) and the “after” (running the script, which takes 30 seconds). The contrast is impossible to ignore. It moves the discussion from abstract costs to a tangible, functional solution they can see.
Here’s a skeleton of what that might look like. This isn’t production code. It’s a demonstration to force a conversation about a real budget.
import requests

import pandas as pd

from datetime import date
# --- Configuration ---
# Use mock endpoints or dev keys. The point is to show data movement.
GA_API_ENDPOINT = "https://api.google.com/analytics/v4/reports:batchGet"
CRM_API_ENDPOINT = "https://api.internalcrm.com/v1/leads"
API_KEY_GA = "YOUR_DEV_API_KEY"
API_KEY_CRM = "YOUR_DEV_API_KEY_2"
OUTPUT_FILENAME = f"poc_report_{date.today()}.csv"
def fetch_ga_data():
"""Fetches sample traffic data. In reality, this is more complex."""
print("Fetching data from Google Analytics API...")
# This is a simplified payload. A real one is a monster.
payload = {
"reportRequests": [{
"viewId": "YOUR_VIEW_ID",
"dateRanges": [{"startDate": "7daysAgo", "endDate": "today"}],
"metrics": [{"expression": "ga:sessions"}],
"dimensions": [{"name": "ga:source"}]
}]
}
# Pretend authentication happens here.
# response = requests.post(GA_API_ENDPOINT, json=payload, headers={'Authorization': f'Bearer {API_KEY_GA}'})
# For a PoC, just mock the return data to avoid auth headaches.
mock_data = {
'source': ['google', 'bing', 'direct'],
'sessions': [1500, 450, 800]
}
print("...GA data fetched.")
return pd.DataFrame(mock_data)
def fetch_crm_data():
"""Fetches sample lead data from an internal CRM."""
print("Fetching data from CRM API...")
# params = {'date_range': 'last_7_days'}
# response = requests.get(CRM_API_ENDPOINT, params=params, headers={'X-API-Key': API_KEY_CRM})
mock_data = {
'source': ['google', 'google', 'direct', 'bing', 'bing', 'google'],
'leads': [20, 5, 12, 4, 2, 8]
}
df = pd.DataFrame(mock_data)
# The API gives raw data; the script must aggregate it. This is part of the value.
aggregated_df = df.groupby('source')['leads'].sum().reset_index()
print("...CRM data fetched and aggregated.")
return aggregated_df
def generate_report():
"""Merges data and outputs a CSV file."""
ga_df = fetch_ga_data()
crm_df = fetch_crm_data()
# The core value proposition: the automated merge.
print("Merging datasets on 'source' column...")
final_report_df = pd.merge(ga_df, crm_df, on='source', how='left').fillna(0)
# A simple calculated metric impossible to do quickly by hand.
final_report_df['conversion_rate'] = (final_report_df['leads'] / final_report_df['sessions']) * 100
# Logic-check the output before saving.
if final_report_df.empty:
raise ValueError("Generated report is empty. Check API sources.")
final_report_df.to_csv(OUTPUT_FILENAME, index=False)
print(f"Success. Report saved to {OUTPUT_FILENAME}")
print("\n--- Report Preview ---")
print(final_report_df.to_string())
if __name__ == "__main__":
generate_report()
This script isn’t pretty, but it’s powerful. It demonstrates fetching, aggregating, merging, and calculating. It’s a machine that does the work of a person, and that’s all you need to show.
Step 4: Frame the Financials as Cost Mitigation
With your PoC built and your Manual Labor Tax calculated, you now translate the technical solution into a financial argument. Do not frame this as a new expense. Frame it as a cost-savings initiative. You are not buying a tool. you are purchasing a permanent reduction in operational drag.
Present a simple table comparing the status quo to the proposed solution.
- Current State (Annual Cost): (Total weekly manual hours) * (Blended hourly rate) * 52 weeks. Example: 15 hours/week * $50/hour * 52 = $39,000.
- Proposed Solution (Annual Cost): (Software subscription cost) + (Estimated annual maintenance hours * Blended hourly rate). Example: ($250/month * 12) + (5 hours/month * $50/hour * 12) = $3,000 + $3,000 = $6,000.
- Net Annual Savings: $39,000 – $6,000 = $33,000.
The numbers do the talking. You’ve just demonstrated a way to reclaim over thirty thousand dollars. You must also include the non-financial benefits, framed as risk reduction. Automation reduces human error in reports. It increases report delivery speed, impacting client satisfaction. It frees up skilled analysts from monkey work to focus on strategy, which impacts client retention.
This is how you get a “yes.” Not by talking about APIs, but by talking about ROI and error reduction.
Step 5: Define the Maintenance and Failure Protocols
Any experienced leader will immediately ask, “What happens when it breaks?” A naive pitch ignores this. A professional one has a plan. Your credibility hinges on demonstrating that you’ve thought about the entire lifecycle of this new process, not just the happy path.
Be upfront about the maintenance tax. APIs change. Credentials expire. Data schemas get updated. Your solution will require monitoring and occasional intervention. Allocate a certain number of hours per month for this maintenance and include it in your cost calculation, as shown in the previous step. This honesty builds trust.
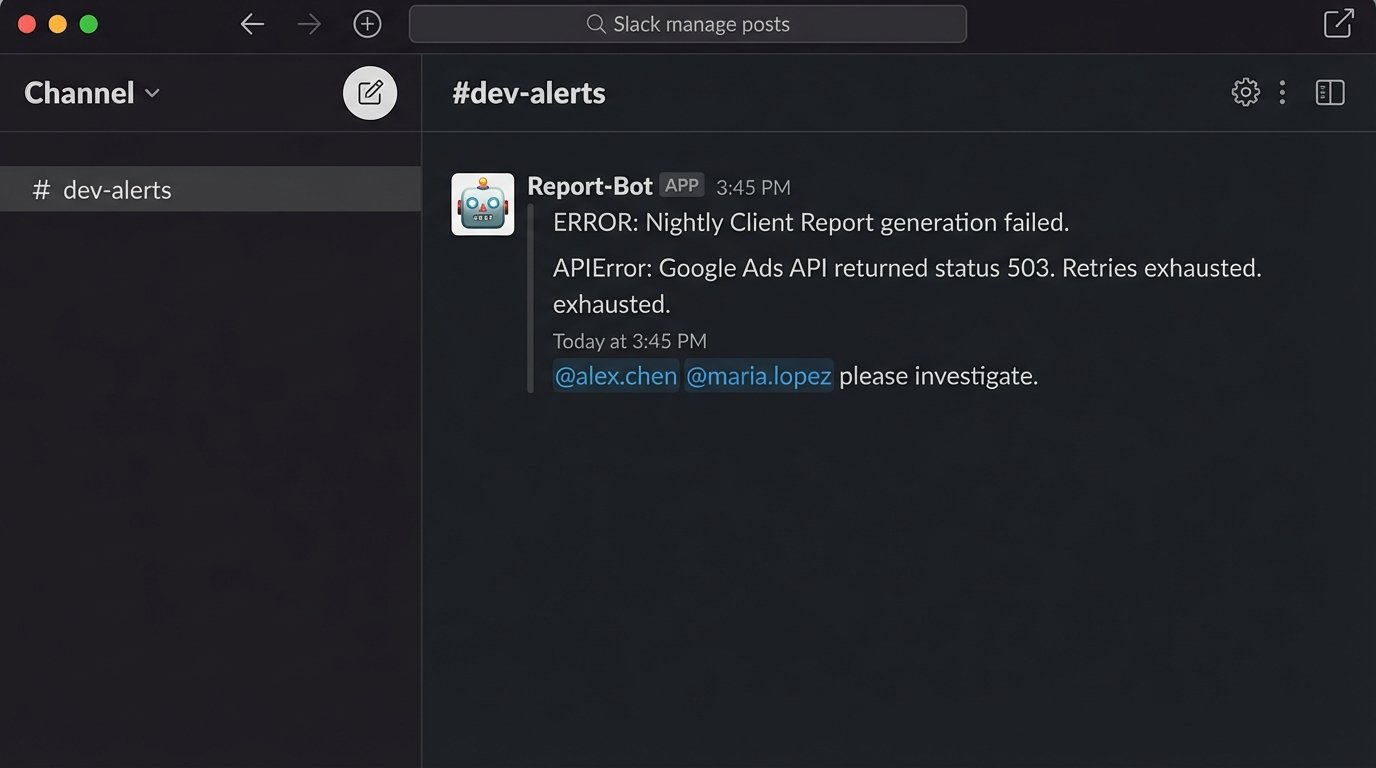
Outline a simple failure protocol. What happens if an API call fails overnight? The system should send an alert to a specific email distro or Slack channel. Who is responsible for debugging it? Define the primary and secondary owners. Having this documented shows you are building a resilient system, not a fragile toy that will become someone else’s problem.
Failing to plan for failure is the fastest way to get your budget request denied.
Your Proposal is a System, Not a Slide Deck
To secure investment, you have to stop thinking like an employee asking for a tool and start acting like an architect presenting a system upgrade. You must do the work upfront to quantify the existing inefficiency and build a functional prototype that proves the viability of your proposed solution.
The process is linear. First, gather the data on the current waste. Second, diagnose the precise technical bottleneck. Third, build a working model that solves it on a small scale. Fourth, translate the outcome into a clear financial case based on cost reduction. Finally, present a realistic plan for maintenance and support.
Agencies that refuse to invest in eliminating internal friction will not be competitive for long. They will either burn out their best talent on repetitive tasks or get outmaneuvered by leaner teams that did make the investment. The cost of inaction is hidden, but it compounds daily.