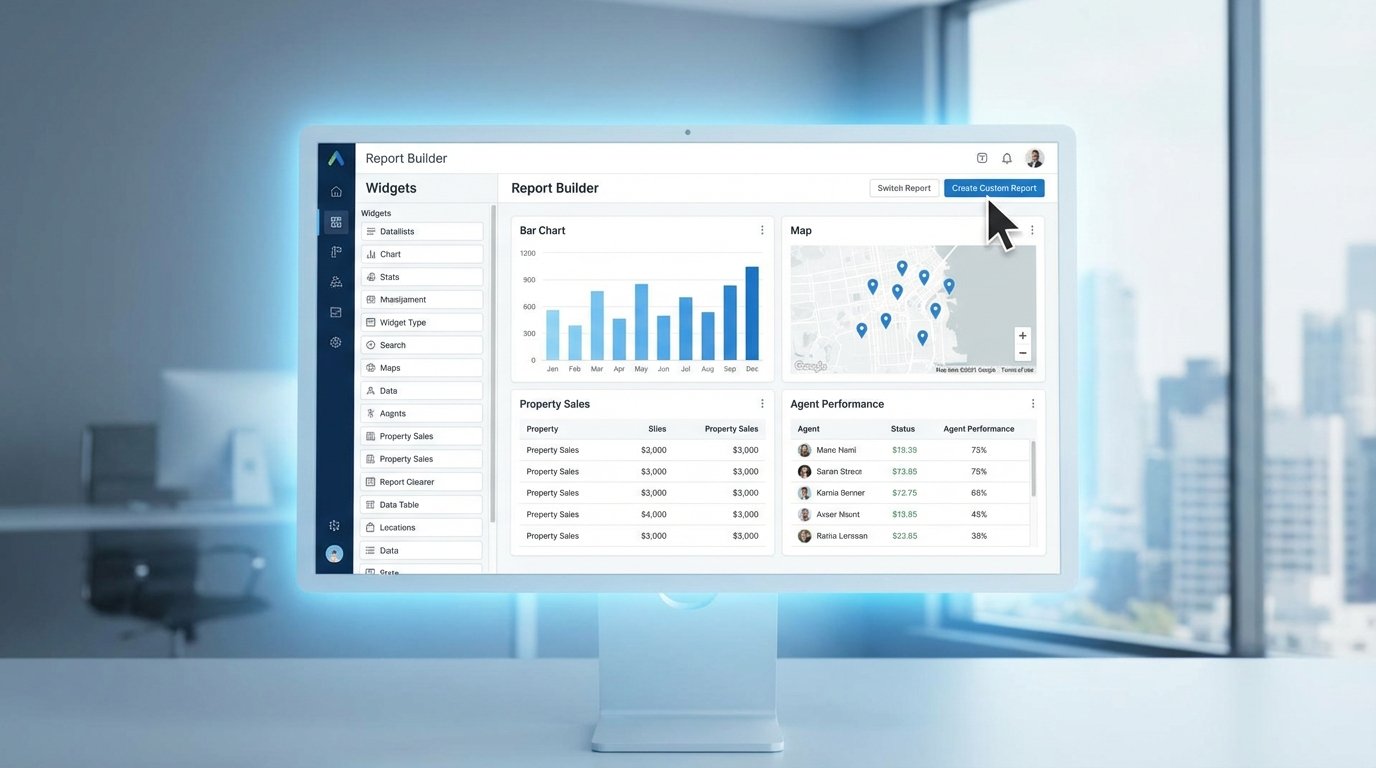
The reporting dashboard in your SaaS real estate CRM is a lie. It’s built for selling widgets, not properties. It tracks “leads” and “deals” in a generic sales funnel that ignores the realities of MLS data, commission splits, and contingent offers. Relying on it is a fast path to miscalculating your pipeline and paying your agents incorrectly.
We’re going to bypass the dashboard entirely. The goal is to hook directly into the CRM’s data store to build reports that answer the questions that matter: which lead source generates the highest GCI, what’s our projected commission for the next 90 days, and which agent is lagging in follow-up tasks. This requires stripping away the UI and working with the raw data.
Prerequisites: Auditing The Data You Actually Have
Before writing a single line of code, you have to map the territory. Building a report without a clear data model is like trying to navigate a city with a blank map. Your first step is to locate the API documentation or database schema for your specific CRM. You are looking for the definitions of primary objects like `Contacts`, `Deals` or `Opportunities`, and any custom objects your team has created for `Properties`.
Pay close attention to custom fields. This is where the standard CRM is bent to fit a real estate brokerage. You’ll find fields like `mls_number`, `commission_percentage`, `closing_date`, and `property_type`. These are the columns that hold the actual value. Document their exact field names or API keys. If the API documentation is five years old, you’ll need to make a few test calls to pull a record and see the real field names in the JSON response.
This audit will also expose your data hygiene problems. If half your agents enter `3%` in the commission field and the other half enter `0.03`, your calculations will be garbage. If closing dates are just text fields instead of validated date formats, your forecasting is a work of fiction. Fix the data entry process first or accept that your report will be fundamentally flawed.
Step 1: Forging the Data Connection
You have two paths to the data: through the front door with an API key, or by picking the lock to the database. The path you choose is dictated by your CRM. SaaS platforms force the API route. Self-hosted instances give you the option of a direct database connection, which is both more powerful and exponentially more dangerous.
The API Route: Slow and Steady
Connecting to a SaaS CRM’s API means dealing with authentication, rate limits, and pagination. Most modern systems use OAuth 2.0, which requires a token exchange and refresh logic to maintain a connection. Simpler ones might just use a static API key passed in the request header. Your first script should do nothing more than authenticate and fetch a single record to prove the connection works.
This Python snippet uses the `requests` library to hit a hypothetical `/deals` endpoint. It passes an API key in the header and includes parameters to control the request, like limiting the fields returned to only what you need. This reduces the payload size and keeps you from hitting data transfer limits prematurely.
import requests

import json
API_KEY = 'your_secret_api_key_here'
CRM_BASE_URL = 'https://api.yourcrm.com/v2/'
headers = {
'Authorization': f'Bearer {API_KEY}',
'Content-Type': 'application/json'
}
# Only request the fields we absolutely need for the report
params = {
'limit': 100,
'properties': 'dealname,dealstage,amount,closing_date,agent_id'
}
response = requests.get(CRM_BASE_URL + 'deals', headers=headers, params=params)
if response.status_code == 200:
deals = response.json().get('results', [])
print(f"Successfully fetched {len(deals)} deal records.")
else:
print(f"Failed to fetch data. Status: {response.status_code}, Response: {response.text}")
Remember API rate limits. If you try to pull 50,000 records in a tight loop, the server will time you out. You must respect the `X-RateLimit-Remaining` header and implement logic that pauses your script or handles `429 Too Many Requests` errors gracefully. This is non-negotiable in a production environment.
The Direct Database Route: High Risk, High Reward
If your CRM runs on your own infrastructure, you can bypass the API and connect directly to its underlying database, likely a PostgreSQL or MySQL instance. This gives you the full power of SQL for complex joins and aggregations, which is vastly more efficient than pulling thousands of records over HTTP and stitching them together in memory. The performance difference is like trying to fill a swimming pool with a garden hose versus a fire hose.
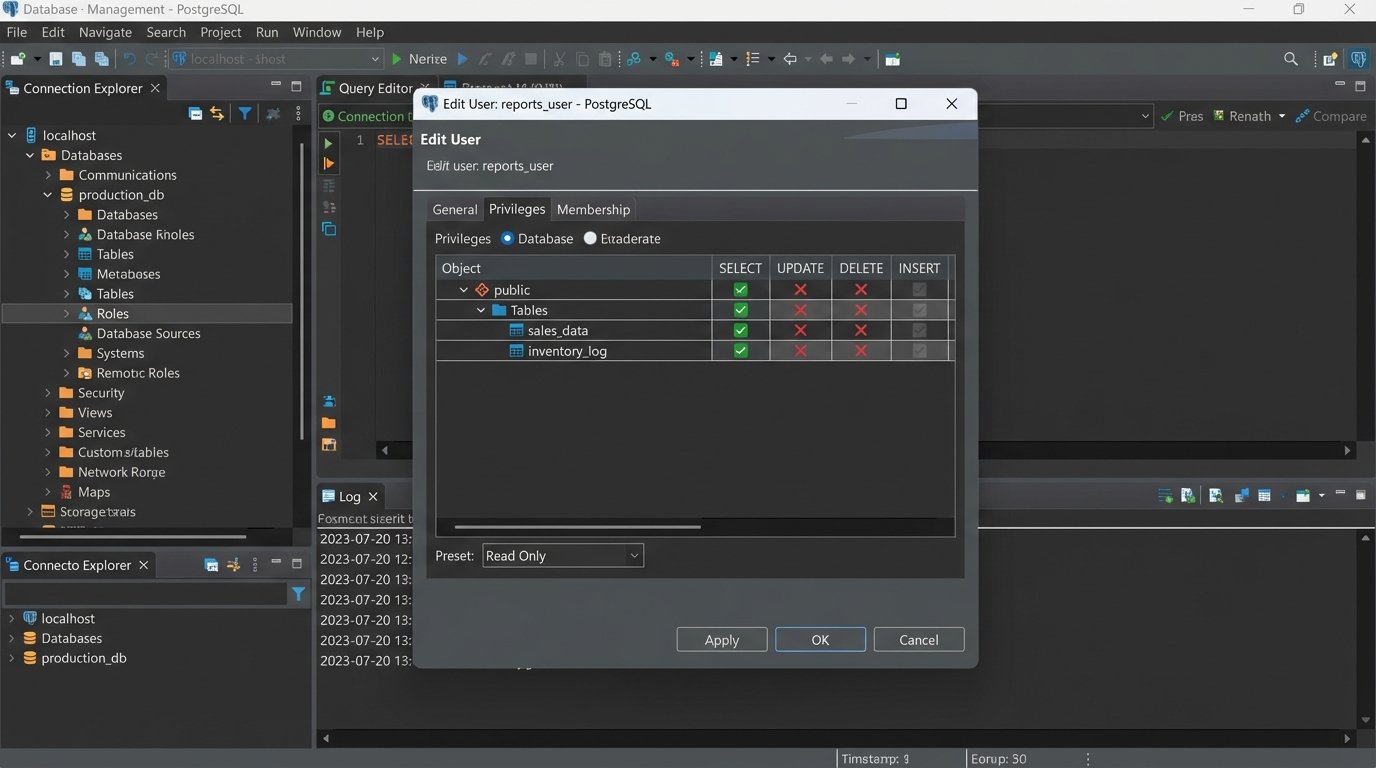
The immediate risk is catastrophic data loss. One bad `UPDATE` statement without a `WHERE` clause can wipe out your entire pipeline. Your first and only rule is to connect using a read-only user. If a read-only role does not exist, create one. If you cannot create one, do not use this method. Connecting with write privileges to a production database for reporting is indefensible negligence.
Step 2: Defining Report Logic and Querying Data
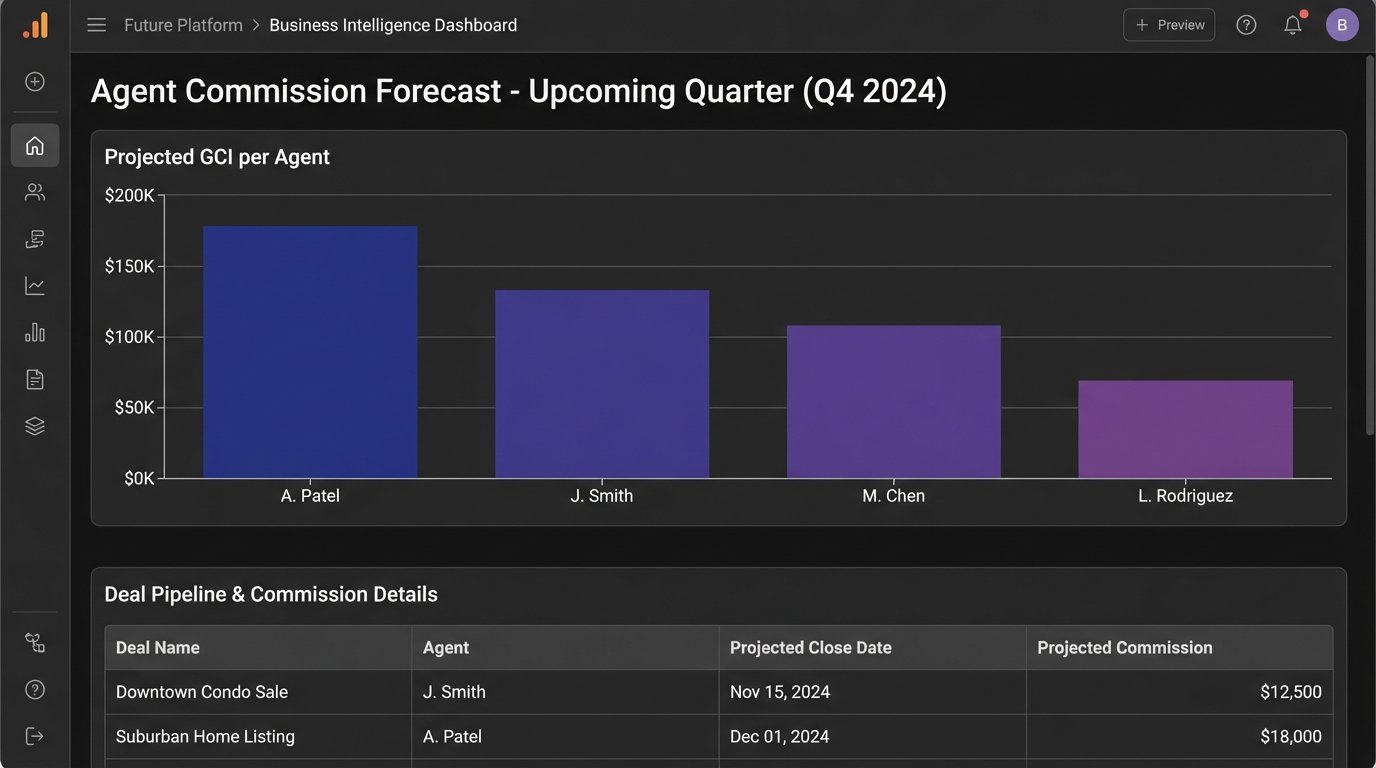
Let’s build a practical report: “Agent Commission Forecast by Quarter.” This report requires data from multiple sources. The `Deals` table has the deal value and closing date. The `Contacts` or `Users` table has the agent’s name, linked by an `agent_id`. The commission split might be a custom field on the `Deals` object or a standard field on the `Users` object. Your query must join these sources together.
For a direct database connection, the SQL query is the heart of the operation. It filters for deals that are not yet closed but are expected to close, joins to the users table to get the agent’s name, and selects all the necessary fields. This single query is far more efficient than the multiple API calls required to achieve the same result.
SELECT

    d.deal_id,

    d.deal_name,

    u.first_name || ' ' || u.last_name AS agent_name,

    d.amount,

    d.commission_rate, -- A custom field for the commission percentage

    d.projected_close_date

FROM

    deals d

JOIN

    users u ON d.agent_id = u.user_id

WHERE

    d.deal_stage NOT IN ('closed_won', 'closed_lost')

    AND d.projected_close_date IS NOT NULL;
If you are forced to use the API, this step is a headache. You first query all relevant deals. Then you must loop through those deals, collect all the unique `agent_id` values, and make a second set of API calls to an `/users` endpoint to fetch the agent names. This multi-request process is sluggish and increases your chances of hitting a rate limit.
Step 3: Transforming and Cleaning the Raw Data
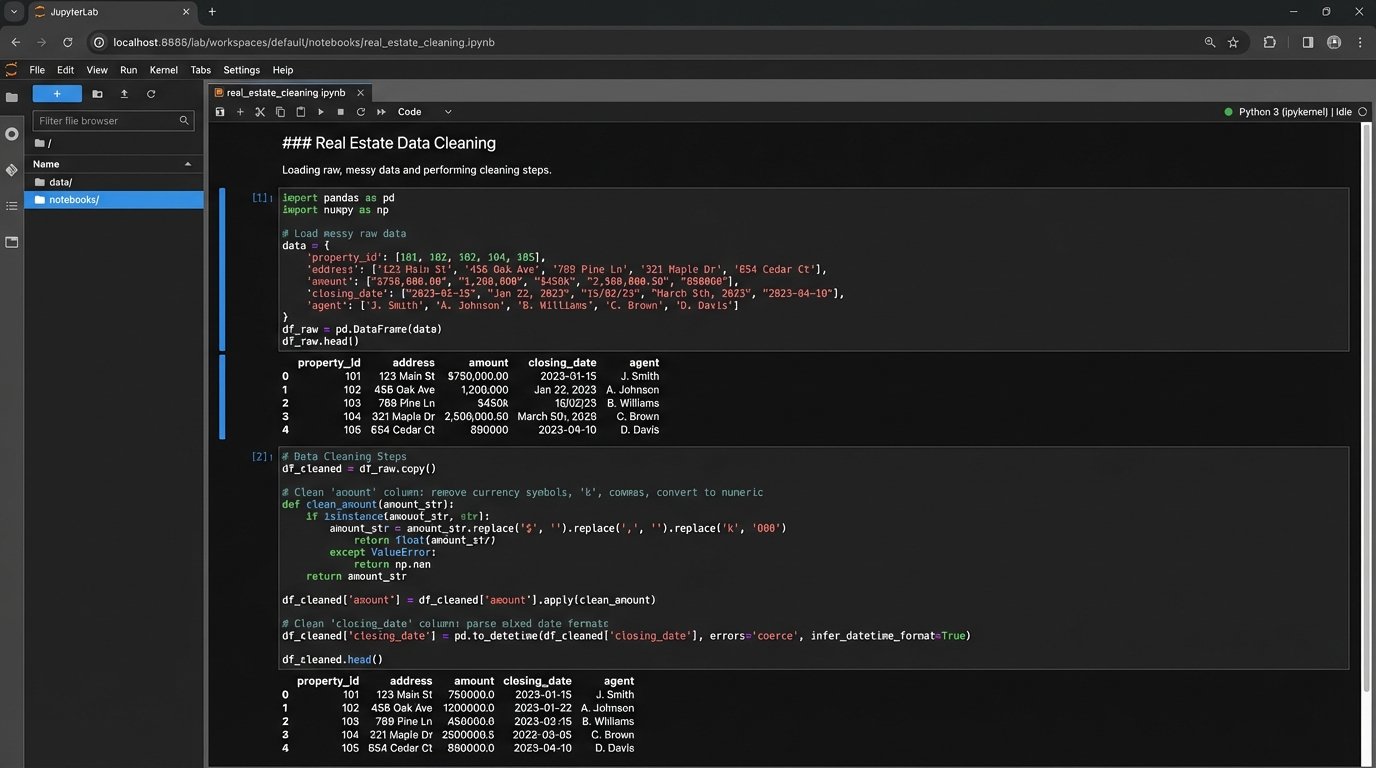
Data pulled from any system is never clean. The `amount` field might be a string like `”$500,000.00″`, which will break any mathematical operation. The `commission_rate` could be stored as `5` instead of `0.05`. Dates can be in a dozen different string formats. You have to force the data into a usable state.
This is a data sanitization process. You strip currency symbols and commas from monetary values and cast them as floats. You parse date strings into true datetime objects so you can perform chronological sorting and filtering. You check commission rates and divide by 100 if necessary. Every field you plan to use in a calculation must be validated and coerced into the correct data type.
Handling nulls is another critical step. What happens if a deal has no `projected_close_date`? Or a `commission_rate` is missing? You must decide on a business rule. Do you exclude the record from the report, or do you substitute a default value? Excluding it means your forecast will be incomplete. Substituting a value means you are introducing an assumption. Document whichever path you take.
Step 4: Calculation and Aggregation
With clean data, you can now perform the calculations. The core calculation for our example is `Projected_Commission`, which is simply `amount * commission_rate`. You create this new column in your dataset for every single deal.
The next step is aggregation. A list of hundreds of individual deals is not a forecast. You need to group the data. Using our goal, we need to group by `agent_name` and then by a time period derived from the `projected_close_date`. This gives you a summary of total projected commission for each agent, bucketed by quarter.
In SQL, this is handled with a `GROUP BY` clause using date functions to extract the quarter and year from the closing date. In a Python environment with Pandas, you would use the `groupby()` method combined with `pd.Grouper` to group by agent and a quarterly frequency. The output is a summarized table, not a raw list of records.
Step 5: Output and Visualization
The final aggregated data needs a destination. How you present it determines if it actually gets used. You have several options, ranging from primitive to sophisticated.
Option 1: The Humble CSV
The simplest output is a CSV file. It’s universally compatible and can be generated with a single line of code. You can write this file to a shared network drive or attach it to an automated email. It contains all the information, but it requires the end-user to open it in a spreadsheet program to make any sense of it. It’s functional, but crude.
Option 2: Pushing to a Business Intelligence Tool
A much better approach is to push the final, cleaned data table into a proper BI tool like Tableau, Power BI, or Google Data Studio. Most of these platforms have APIs or connectors that allow you to programmatically update a data source. This allows you to build rich, interactive dashboards that are automatically refreshed by your script. This is more setup work upfront but delivers a far superior result for stakeholders.
Option 3: Generating a Self-Contained HTML Report
For simple, non-interactive reports sent via email, you can convert your final data table into an HTML table. Python libraries like `jinja2` can be used to inject your data into an HTML template. The script then generates a complete HTML file or string, which can be embedded directly into an email body. This is a good middle-ground for automated daily or weekly summaries.
Validation and Long-Term Maintenance
Your script is not finished when it runs without errors. It is finished when the numbers it produces are correct. Manually check the output against the CRM’s UI for a handful of agents and deals. Find a complex record and walk your script’s logic step-by-step to confirm that the transformations and calculations match reality. A tiny mistake in your query’s `WHERE` clause can silently exclude millions of dollars in your pipeline.
This report will break. It is a matter of when, not if. An administrator will add a new deal stage that your filter logic doesn’t account for. The CRM provider will deprecate an API endpoint you rely on. A custom field key might be changed. You must treat this script as a piece of production software. Implement logging to track its execution and error handling to notify you when it fails. Schedule periodic reviews to ensure the logic still aligns with the business process. A report that is not maintained quickly becomes a source of misinformation.