Stop Believing the Sales Demo: A Pilot Test Protocol
Another automation platform just landed on your desk. The demo was slick, full of dashboards lighting up like a Christmas tree, and the sales engineer promised it would solve world hunger and your CICD pipeline problems. Before you sign a six-figure contract based on a PowerPoint deck, you need to run a proper pilot. This isn’t about proving the tool works. It’s about proving it doesn’t break your environment when things inevitably go wrong.
A pilot test is a controlled demolition. The goal is to find the tool’s failure points within a sandboxed segment of your infrastructure, not during a production deployment at 2 AM. Most pilots fail because they are designed to succeed, coddled with perfect data and ideal network conditions. We will do the opposite. We will design our pilot to find the breaking points.
Phase 0: Isolate the Blast Radius
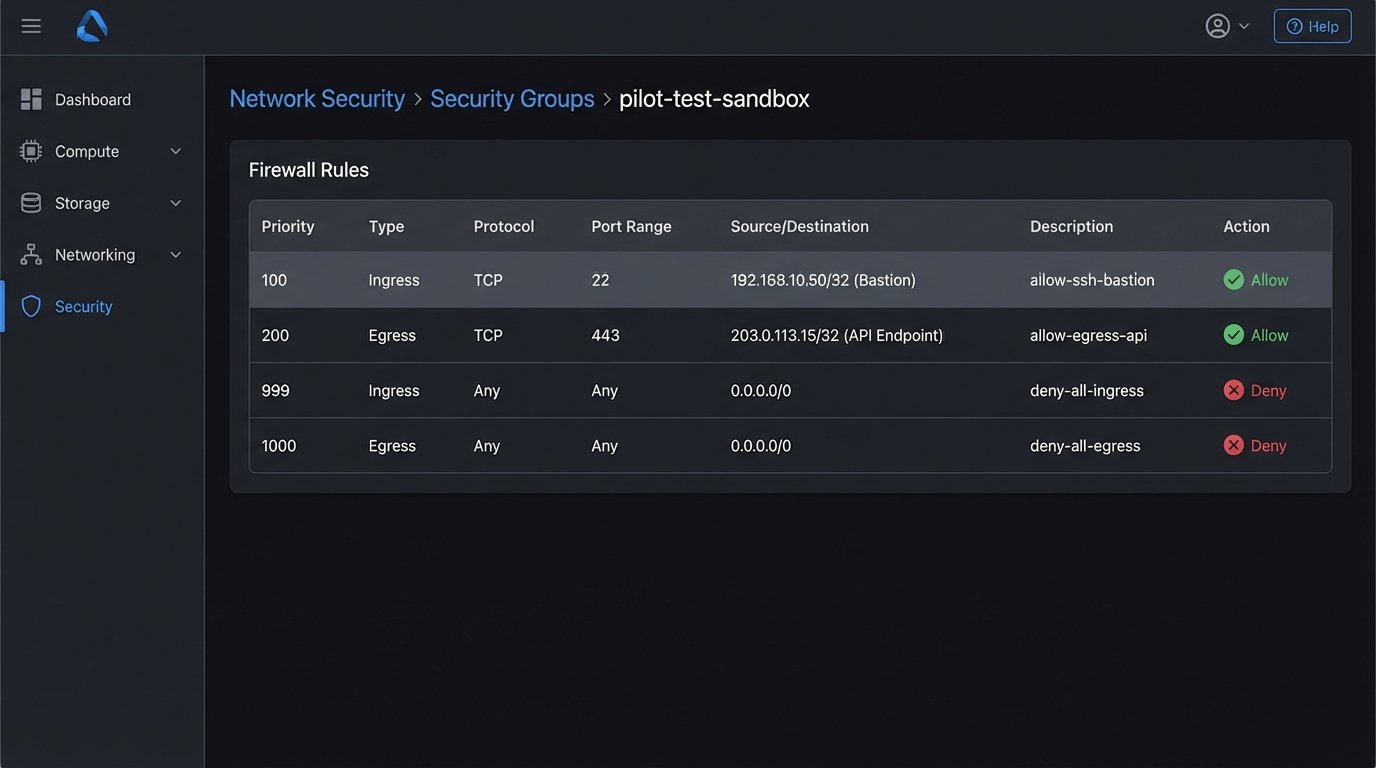
First, you build the cage. The new tool gets no production access. It gets no direct path to your primary databases. It operates in a dedicated, resource-limited VPC or namespace with tightly controlled IAM roles. We are not testing its ability to perform under ideal conditions; we are testing its behavior when starved of resources and permissions. This is the first filter. If the tool requires root access to everything just to install its agent, the pilot is over before it begins.
The network policy for this sandbox needs to be default-deny. You explicitly whitelist egress and ingress traffic only for the specific endpoints required for the test. We need to log every single network call the tool makes. If it’s calling home to a metrics server you didn’t know about, you need to see that. Assume the tool is insecure until proven otherwise.
You need a separate set of credentials for everything. The pilot uses its own API keys, its own service accounts, and its own database user. These credentials should be scoped with the absolute minimum required permissions to execute the pilot task. When the pilot is over, you nuke these credentials from orbit. No exceptions.
Phase 1: Define the Kill Switch and Rollback Path
Before you run a single command, you define the conditions for terminating the pilot. These are not subjective feelings. They are hard metrics. What is the maximum acceptable latency for a single transaction? What is the error rate threshold? How many CPU cores can it consume before you pull the plug? Write these down and get the team to agree on them.
The rollback plan is not “uninstall the software.” A real rollback plan details the steps to revert any changes the tool made to the target system. If the pilot involves modifying a configuration file, the rollback is to restore the previous version from source control. If it writes to a test database, the rollback is a script to truncate the tables it touched. This must be automated. A manual rollback plan is a recipe for a production outage later.
This is where you check the tool’s state management. Does it write its state to a local file, a cloud bucket, or its own managed database? You need to know how to back up and restore this state. If the vendor says their cloud platform handles it, demand access to the API for forcing a snapshot and a restore. Trusting a vendor’s “magic” backup system without a way to verify it is just negligence.
Phase 2: Select a Single, Painful Process
Do not pick an easy problem for the pilot. Pick something that is a persistent source of operational drag. A good candidate for a pilot has a few key properties:
- High Frequency: The process runs multiple times a day. This gives you enough data points within a short pilot window (e.g., one week) to spot trends.
- Low Complexity: It has a limited number of steps and dependencies. You are testing the tool, not trying to re-architect your entire workflow at the same time.
- Measurable Impact: You can quantify the “before” state. You know exactly how long it takes a human to do it, or the error rate of the current script that handles it. Without a baseline, you can’t prove value.
- No Catastrophic Failure Mode: If the automation fails, it should be an inconvenience, not a system-wide outage. Automating user de-provisioning is a great candidate. Automating root certificate rotation is not.
An example might be automating the creation of a new project in your Git repository, which includes creating the repo, applying branch protection rules, and creating a corresponding ticket in the project management system. It’s repetitive, annoying, and its failure is easily contained.
Phase 3: The Minimal Viable Configuration
The goal here is to get the tool to execute one successful run, and nothing more. Do not enable notifications. Do not configure high availability. Do not integrate it with every monitoring system you have. You need to find the absolute shortest path from installation to a single “green” run. This process forces you to understand the core configuration logic of the tool.
Document every single configuration change you make. Use a dedicated git repo for the config files. This isn’t just good practice; it’s a diagnostic tool. When something breaks after you change a setting, you have a clear diff to point to. Relying on the tool’s audit log is a mistake, as you have no idea what it chooses not to log.
This phase often exposes the gap between documentation and reality. The config file syntax in the official docs might be from two versions ago. The required parameters might be mislabeled. You’re not just configuring a tool; you’re debugging its documentation. Forcing a tool to run with a bare-bones setup is like trying to connect two different gauges of pipe; you quickly discover if the adapter fitting the vendor gave you was machined correctly or just looks right on paper.
Phase 4: Data Ingress and API Sanity Checks
Automation tools live and die by the APIs they talk to. Before you let the new tool run its logic, you need to independently verify the endpoints it will use. Can you reach the target API from the sandboxed environment? Is there a firewall rule you missed? Are you being rate-limited?
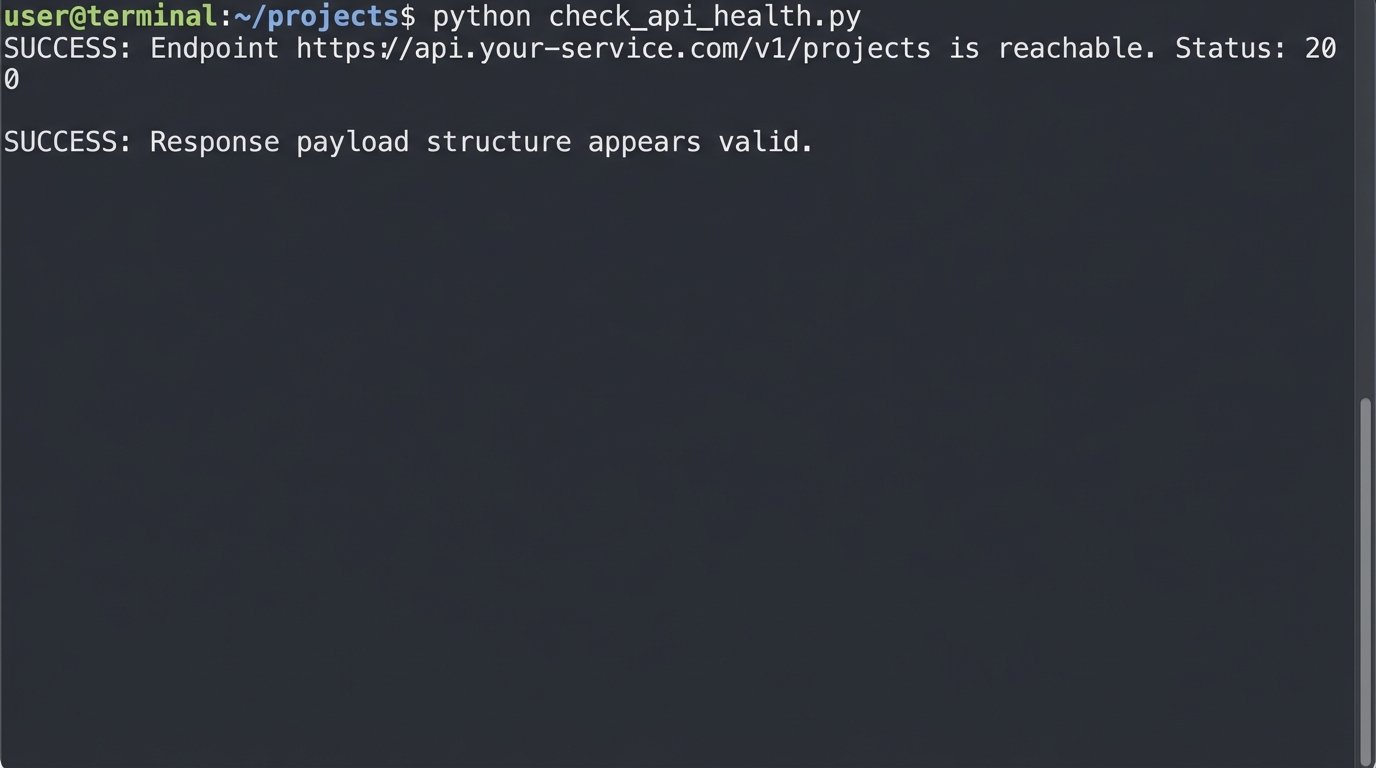
A simple script to check the health of a critical endpoint is not optional. You need to bypass the tool’s own SDK or abstraction layer and hit the raw API. This tells you if a failure is the tool’s fault or the underlying infrastructure’s fault.
import os
import requests

API_TOKEN = os.getenv('PILOT_API_TOKEN')
TARGET_ENDPOINT = 'https://api.your-service.com/v1/projects'
HEADERS = {
    'Authorization': f'Bearer {API_TOKEN}',
    'Content-Type': 'application/json'
}

def check_endpoint_health():
    try:
        response = requests.get(TARGET_ENDPOINT, headers=HEADERS, timeout=5)

        if response.status_code == 200:
            print(f"SUCCESS: Endpoint {TARGET_ENDPOINT} is reachable. Status: {response.status_code}")
            # Optional: Check for a key in the response to validate the payload structure
            data = response.json()
            if 'data' in data and isinstance(data['data'], list):
                print("SUCCESS: Response payload structure appears valid.")
            else:
                print("WARNING: Response payload structure is unexpected.")
        else:
            print(f"FAILURE: Endpoint returned non-200 status: {response.status_code}")
            print(f"Response Body: {response.text}")

    except requests.exceptions.RequestException as e:
        print(f"CRITICAL: Failed to connect to {TARGET_ENDPOINT}. Error: {e}")

if __name__ == "__main__":
    if not API_TOKEN:
        print("CRITICAL: PILOT_API_TOKEN environment variable not set.")
    else:
        check_endpoint_health()
Running this simple check before you even configure the corresponding part of the tool can save you hours of debugging. If the script fails, the tool never had a chance.
Phase 5: Supervised Execution and Telemetry
Now you run the pilot. The first few runs are supervised. You trigger the automation manually and watch the logs in real-time. You are looking for unexpected behavior, strange log entries, or performance spikes. Do not let it run on a schedule until it has completed at least 10-20 manual runs without any surprises.
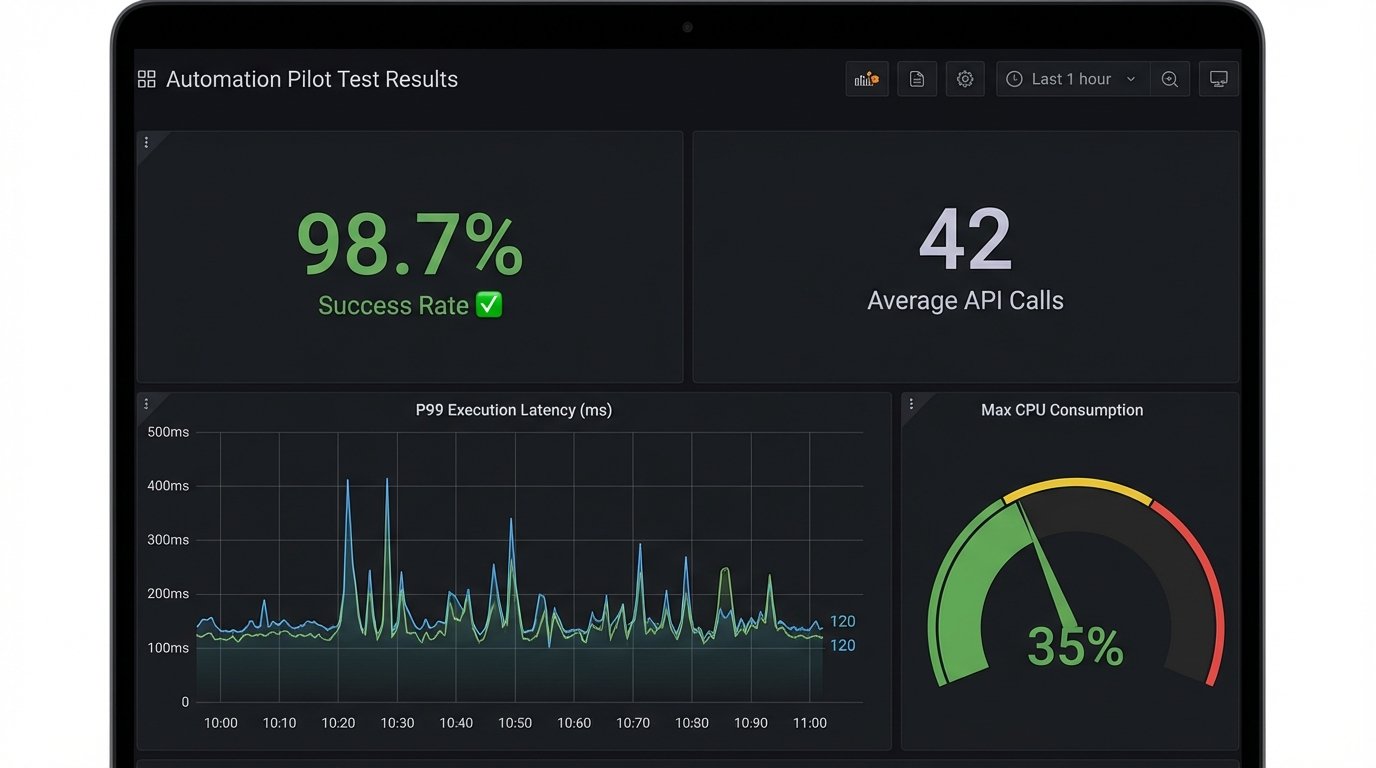
Measurement is everything. You need to capture data on:
- Execution Time: The wall-clock time from trigger to completion. Track the average, P95, and P99. A tool that is fast on average but has high tail latency is a production incident waiting to happen.
- Resource Consumption: CPU and memory usage during execution. Does it have a memory leak? Does it spike CPU and starve its neighbors?
- API Call Volume: How many API calls does it make to perform the task? Is it inefficient? Hitting API rate limits because your new tool is too chatty is a common and avoidable problem.
- Success/Failure Rate: The most obvious metric, but track the reasons for failure. Is it bad input, a transient network error, or a bug in the tool’s logic?
Trying to inject this level of observability after the fact is a nightmare. Integrating it from the start means you’re not just testing the tool, you’re building the monitoring framework for it at the same time. This is about forcing a high-voltage current through a low-gauge wire in a controlled setting; you want to see what melts before you wire it into your main breaker panel.
Phase 6: The Post-Mortem and the Go/No-Go Decision
At the end of the pilot period, you assemble the team and review the data. This meeting is not a demo. It’s a critical review. The primary question is not “Did it work?” The question is “What did we learn when it failed?”
The discussion should be structured around the initial goals. Did it reduce the manual effort required for the process? By how much? Did it introduce new operational risks? What is the estimated effort to productionize this tool, including building out proper monitoring, logging, and incident response playbooks?
The final decision should be a simple matrix comparing the measured benefits against the operational cost and risk. Often, a tool works perfectly but requires so much care and feeding that it’s a net loss. The pilot gives you the data to make that call without emotion. If the pilot fails, it’s a success. It means you saved the company from buying the wrong tool.
A successful pilot test provides a clear, data-backed recommendation. It either confirms the tool is a viable solution worth the investment, or it provides a list of concrete reasons why it’s a poor fit for your environment. There is no middle ground. You go, or you no-go. Anything else is just kicking the decision down the road.