The Source of Truth Is a Lie
The weekly marketing meeting starts with a lie. The SEO team presents a Google Search Console report showing 50,000 clicks. The analytics team shows a Google Analytics 4 report with 45,000 organic sessions. The paid media team, pulling from their own platform, has a completely different number for attributed conversions. The next hour is a circular argument about whose numbers are right.
This is the direct result of treating source platforms as gospel. They are not. Each platform defines metrics differently, uses different attribution models, and applies sampling when it feels like it. A “user” in GA4 is not the same as a contact in HubSpot, and neither matches the definition of a “lead” in Salesforce. Relying on the native UI of ten different tools guarantees conflicting reports.
The core failure is decentralized data. When every team pulls their own numbers from their preferred tool, you don’t have a data-driven strategy. You have a data-driven argument. The goal is to stop debating the numbers and start debating the actions the numbers suggest.
Architecting a Single Pane of Glass
A dashboard is not a solution. It’s the output of a solution. The actual fix is a centralized data pipeline that rips raw data from source systems, forces it into a consistent model, and then feeds it to a visualization layer. This architecture has three non-negotiable stages: extraction, transformation, and loading.
This isn’t a weekend project. This is infrastructure.
Stage 1: Extraction
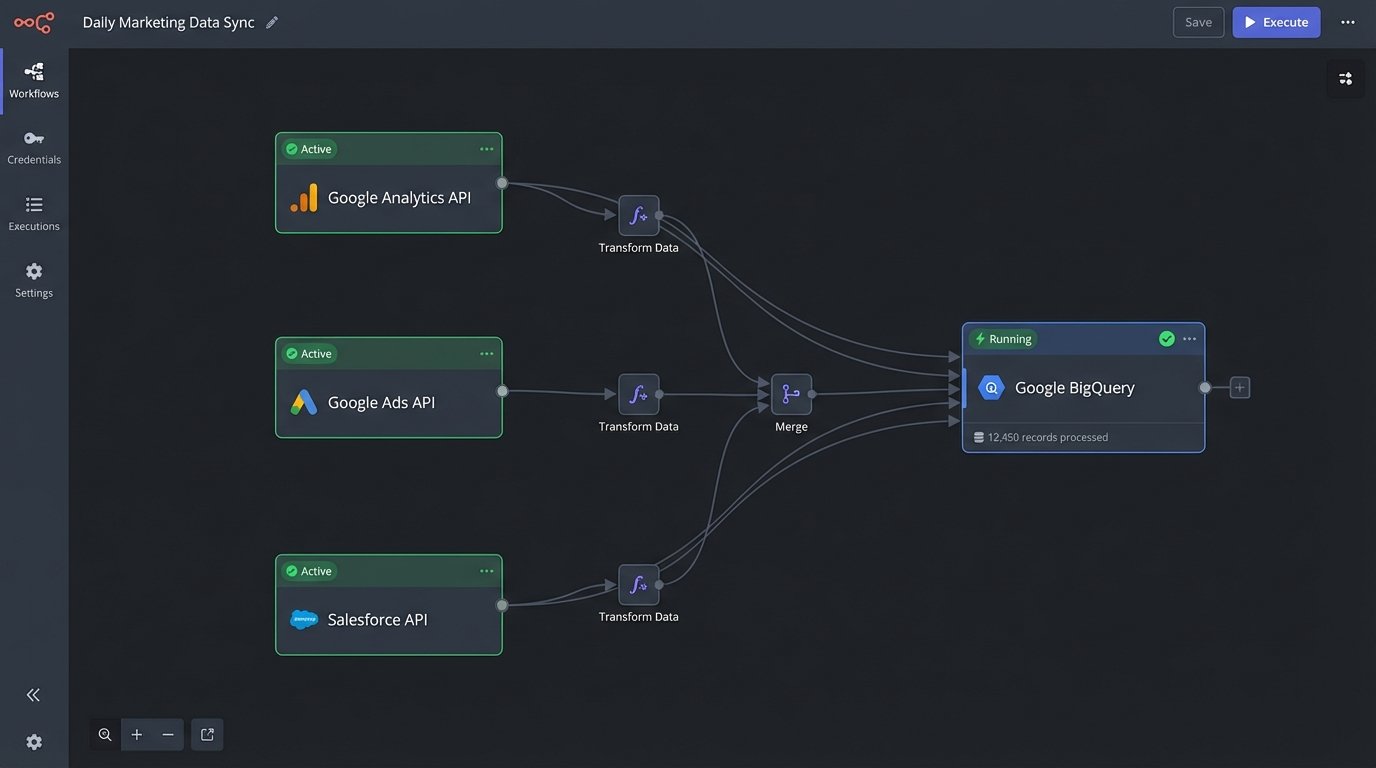
Extraction is the process of pulling data from platform APIs. This means writing scripts, typically in Python, that authenticate via OAuth 2.0, handle request limits, and manage pagination. You will hit endpoints for Google Analytics, Google Search Console, your ad platforms, your CRM, and any other tool that holds a piece of the puzzle. You are pulling the rawest, most granular data possible.
You can bypass some of this misery with a third-party connector like Fivetran or Stitch. These are wallet-drainers but can save you hundreds of engineering hours. The decision is simple: pay with money or pay with time. Either way, the goal is the same. Land the raw, unaltered data in a cloud storage bucket or directly into a data warehouse.
Stage 2: Transformation
Raw data is a mess. The transformation stage cleans, normalizes, and remodels the data into a usable format. This is where the actual “source of truth” is forged. This work happens inside a data warehouse like Google BigQuery, Snowflake, or Redshift, using SQL. You write models that join data from different sources and enforce your own business logic.
This is where you define, in code, what a “session” means for your business. You might join GA4 session data with Salesforce lead data to create a unified customer journey view. You write a SQL CASE statement to classify keywords as “branded” or “non-branded” instead of relying on GSC’s flawed filter. The logic is explicit, version-controlled, and peer-reviewed. No more guesswork.
Stage 3: Loading and Visualization
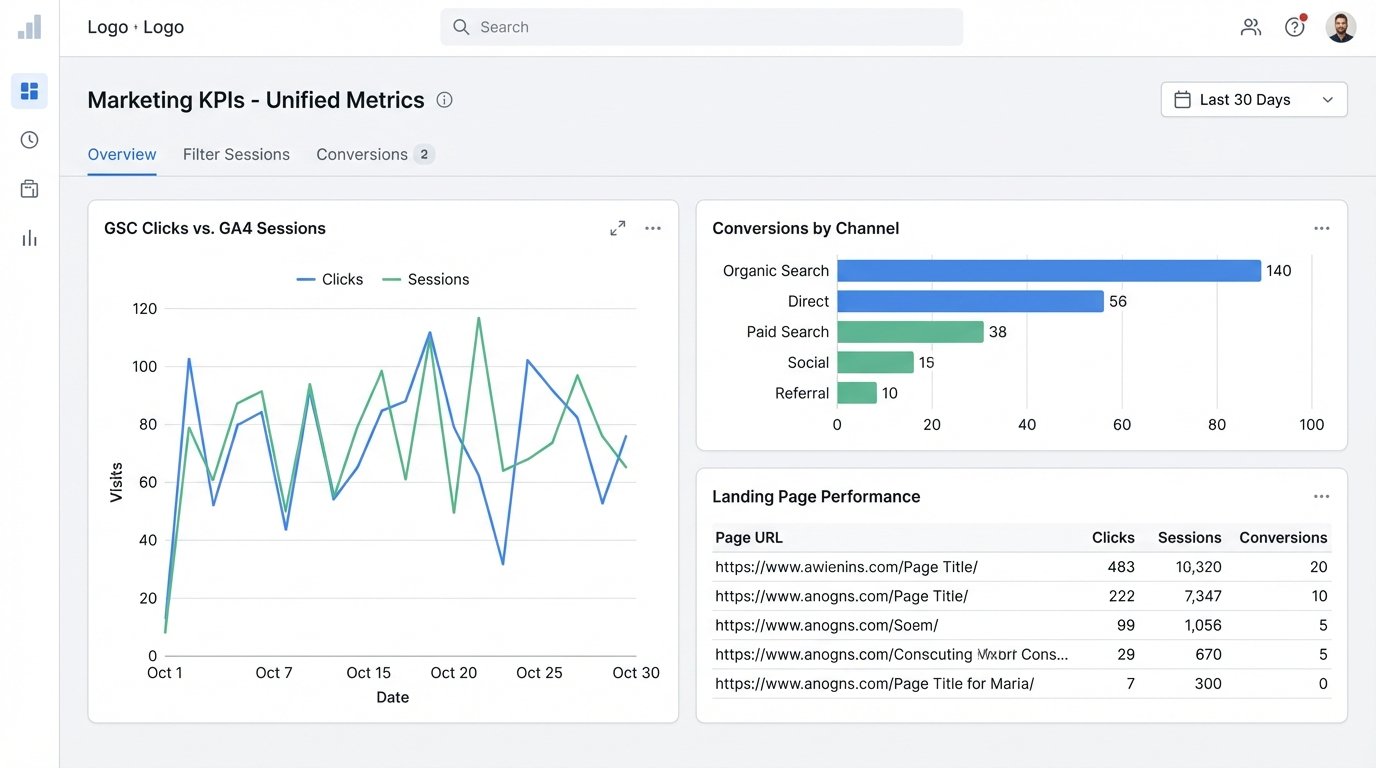
The final stage is loading these clean, transformed tables into a set of “mart” tables. These are the final, aggregated tables that power your dashboards. Your visualization tool, whether it’s Looker Studio, Tableau, or Power BI, should *only* query these mart tables. It never touches the raw source data. This makes the dashboards fast and ensures every chart is built from the same consistent, vetted source.
The dashboard becomes a dumb terminal. Its only job is to display the pre-calculated truth. All the heavy lifting and logical decisions have already been made upstream in the warehouse.
Wrangling the APIs: Rate Limits and Bad Documentation
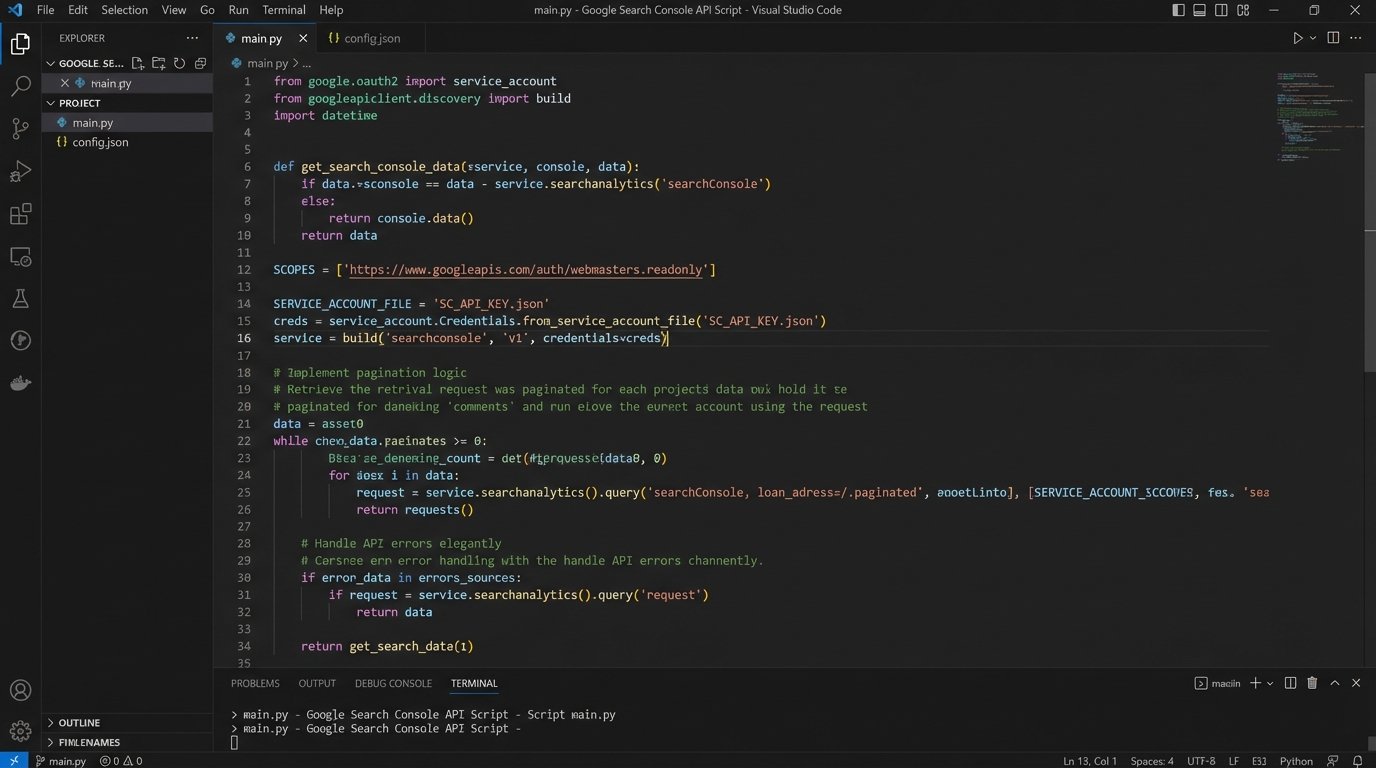
The extraction phase is a minefield. Every API has its own unique set of undocumented “features” and aggressive rate limits. The Google Search Console API, for example, will happily serve you data but caps requests at 2,000 rows. To get a full dataset for a large site, you must build a pagination loop that makes repeated calls, being careful not to exhaust your daily quota.
Your scripts need to be defensive. They must include logic for exponential backoff, automatically retrying a failed request after a progressively longer delay. They must log every action, so when a job fails at 3 AM, you can see exactly which API call choked. You will spend more time on error handling than you will on the core data-pulling logic.
Trying to reconcile these different data schemas is like trying to wire a European appliance into a US socket using speaker wire. It might spark, but it’s not going to work right.
Assume the official documentation is at least six months out of date. The only reliable source of truth is making a test call and inspecting the JSON response yourself. Prepare for field names to change without warning and for endpoints to be deprecated with a single email notification that goes directly to your spam folder.
A basic Python function to handle GSC pagination might look something like this. Notice the loop that keeps running as long as the API response contains data.
    def get_gsc_data(webproperty, api_service, request):

        all_rows = []

        start_row = 0

        while True:

            request['startRow'] = start_row

            response = api_service.searchanalytics().query(

                siteUrl=webproperty, body=request).execute()
if 'rows' not in response:
break # No more data
all_rows.extend(response['rows'])
start_row += len(response['rows'])
# Add a small sleep to be kind to the API
time.sleep(0.5)
return all_rows
The Transformation Layer: Where Arguments Go to Die
The real magic happens in the data warehouse. Using a tool like dbt (Data Build Tool) or just a series of scheduled SQL scripts, you build a dependency graph of data models. You start with “staging” models that do basic cleaning on the raw data. Then you build intermediate models that join different sources together. Finally, you create the final “mart” tables for reporting.
This is where business logic becomes immutable code. Want to define a “high-value session”? Write a SQL model that flags sessions that visited a pricing page or spent more than three minutes on site. Once it’s coded and merged, that is the definition. It removes all ambiguity. The debate moves from “What’s the right number?” to “Is this SQL query correctly implementing our strategy?” which is a far more productive conversation.
Here is a simplified SQL query showing how you might join GSC and GA4 data in BigQuery to see landing page performance. The key is joining on a normalized URL and date.
    WITH gsc_data AS (

      SELECT

        query_date,

        page_url,

        SUM(clicks) AS gsc_clicks,

        SUM(impressions) AS gsc_impressions

      FROM `your_project.raw_data.gsc_table`

      GROUP BY 1, 2

    ),
ga4_data AS (
SELECT
event_date,
landing_page_url,
SUM(sessions) AS ga4_sessions,
SUM(conversions) AS ga4_conversions
FROM `your_project.raw_data.ga4_table`
GROUP BY 1, 2
)
SELECT
gsc.query_date,
gsc.page_url,
gsc.gsc_clicks,
ga4.ga4_sessions,
ga4.ga4_conversions
FROM gsc_data gsc
LEFT JOIN ga4_data ga4
ON gsc.query_date = ga4.event_date
AND gsc.page_url = ga4.landing_page_url
Choosing the Warehouse and Visualization Tool
The choice of technology is less important than the architectural pattern. Google BigQuery is a logical choice if your primary data sources are in the Google ecosystem. Snowflake excels with its separation of storage and compute, which can be more cost-effective for spiky workloads. Amazon Redshift is a solid option if your organization is already heavily invested in AWS.
For visualization, Looker Studio is free and functional, but it becomes sluggish with complex queries or large datasets. Tableau is a powerful, expensive workhorse that can handle almost anything you throw at it. Power BI is the default for any organization embedded in the Microsoft stack. Pick the tool that fits your budget and existing tech stack. A perfect dashboard connected to bad data is just a fast way to make wrong decisions.
Maintenance Is Not Optional
A data pipeline is not a fire-and-forget weapon. It’s a living system that requires constant monitoring and maintenance. APIs will change, breaking your extraction scripts. Source data schemas will be updated, breaking your transformation models. You must have automated alerting in place to notify you when a job fails.
Data quality checks are also critical. You should have automated tests that run after each pipeline refresh to check for anomalies. Did session volume suddenly drop by 80%? Did revenue for a specific channel go to zero? These checks can catch upstream data issues before they make it into a report for a C-level executive.
This system requires ownership. Someone needs to be on the hook for fixing it when it breaks. Without that commitment, your centralized dashboard will slowly decay, and teams will revert to pulling their own numbers. You will be right back where you started.
Building this architecture forces a cross-functional agreement. Marketing, sales, and engineering must sit in a room and agree on the precise definitions for the metrics that run the business. Those definitions are then implemented in code, creating a stable foundation for all future analysis. The arguments about whose number is right finally stop. The real work can begin.