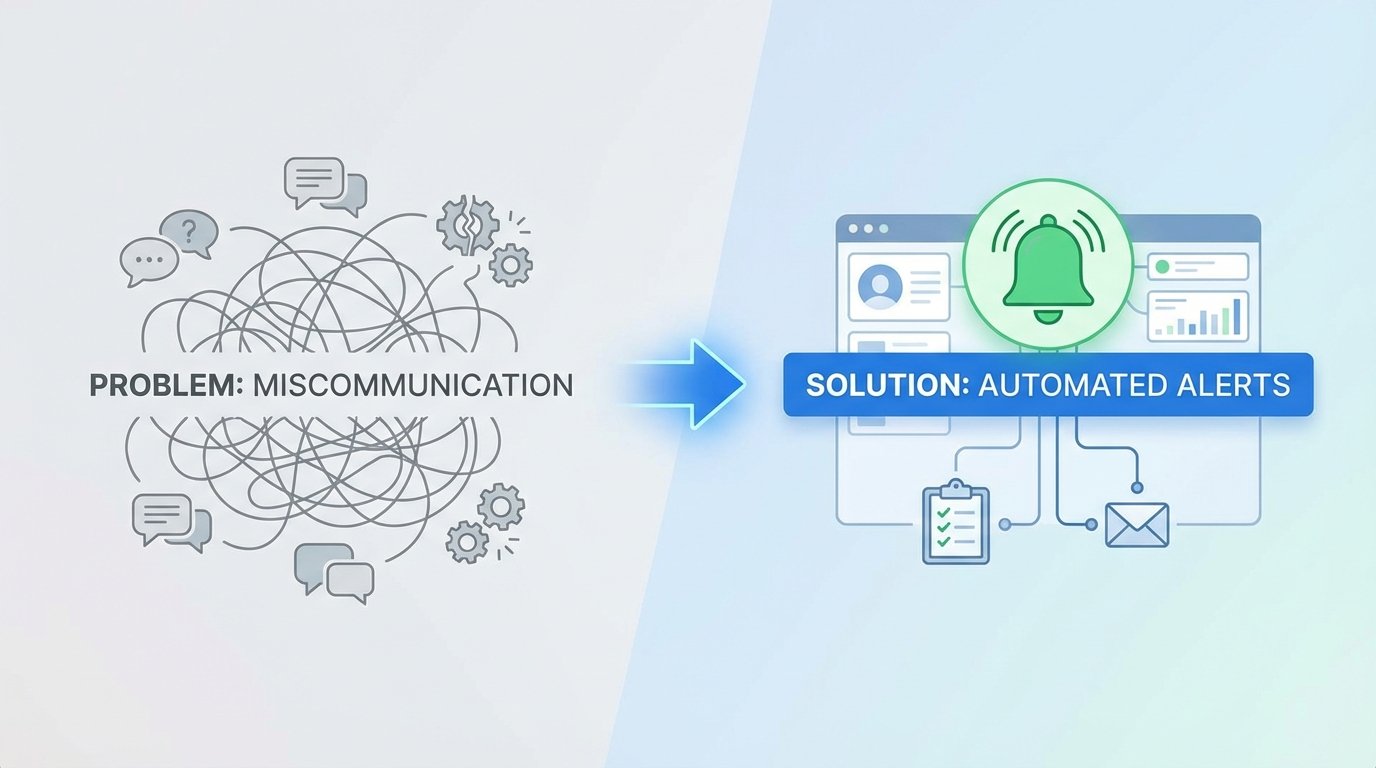
Stop Blaming People for Process Failures
A production deployment fails at 2 AM. The on-call engineer discovers a critical microservice dependency was updated, but the new environment variable was never applied to the production Kubernetes config map. The developer who made the change is asleep. The SRE team is blind. The root cause is not a person. It is a gap in information flow. The process is broken because it relies on a human remembering to type a message in a chat channel.
This entire class of failure stems from a simple, repeated mistake. We treat cross-team communication as a soft skill instead of an engineering problem with a technical solution. Manual handoffs, verbal agreements, and wiki pages are points of failure. They are asynchronous, unreliable, and lack the capacity to force a state change. The fix is not more meetings. The fix is to architect a system where state changes in one domain automatically broadcast structured, actionable signals to others.
The Architecture of Signal, Not Noise
The objective is to build a low-latency nervous system for your engineering organization. This is not about flooding a Slack channel with every git commit. That is noise, and it trains people to ignore alerts. The goal is to identify specific, high-value events and route them to the precise team or system that needs to act on that information. Anything less is a waste of compute cycles and human attention.
A functional system has three distinct parts:
- Event Emitters: These are the source of truth. A CI/CD pipeline like Jenkins or GitLab CI, a version control system hook from GitHub, an infrastructure event from Terraform Cloud, or a state change from a Kubernetes operator. These systems already know when something important happens. We just need to listen.
- A Routing Layer: This is the logic core. It can be as simple as a Python script running in a container or a serverless function. It ingests a raw, often messy, webhook payload, parses it, extracts the critical data, and determines the destination. It decides if a build failure is critical enough for PagerDuty or just needs a ticket in Jira.
- Notification Endpoints: This is where the signal terminates. It could be a human-readable message in Slack or Microsoft Teams. It could be a machine-to-machine API call that updates a Jira ticket, creates an event marker in Datadog, or triggers another automated workflow.
The router is the most critical component. A dumb passthrough that just forwards JSON from GitHub to Slack is lazy and creates noise. A smart router is a gatekeeper. It holds the logic to suppress, enrich, or reroute information. It is the difference between a fire alarm and a constant, low-level hum.

Anatomy of an Alert That Doesn’t Get Ignored
Engineers develop an allergy to low-value notifications. An alert that just says “Build Failed” is useless. It lacks context and forces the recipient to stop their work and manually investigate. This is a critical design flaw. Every single automated alert must be built to minimize the cognitive load on the recipient, whether human or machine.
A high-value alert provides answers, not just questions. It must contain four elements:
- The System of Record: Where did this event originate? `[GitHub]`, `[Jenkins-Prod]`, `[Terraform-Cloud]`
- The Explicit State Change: What happened? “Deployment to `staging-api` succeeded.” or “Security scan detected 3 critical vulnerabilities.”
- The Actor and Object: Who or what caused this? “Commit `f4a9b1c` by `a.smith`” or “Automated nightly build.”
- The Call to Action: What is the immediate next step? “View Logs: [URL]” or “Acknowledge in PagerDuty: [URL]” or “Jira Ticket `PROJ-451` has been moved to ‘QA’.”
Anything less is just contributing to the noise. If an alert requires someone to open three different browser tabs to understand its meaning, it has failed. The goal is to make the notification itself a self-contained unit of work. This is the difference between reporting a problem and assigning a task.
Practical Implementation: Bridging Git and Project Management
Let’s walk through a concrete example. A developer is working on a feature tied to a Jira ticket, `PROJ-451`. The current process requires them to merge their code, then manually navigate to Jira, find the ticket, and drag it from “In Progress” to “Ready for QA”. This is a small, repetitive task that is easily forgotten.
We can automate this entirely. The new workflow requires the developer to include the ticket number in their git merge commit message, like: `feat: add user authentication endpoint [PROJ-451]`. That is the only change to their workflow.
Behind the scenes, the architecture looks like this:
- GitHub Webhook: A webhook is configured in the repository to fire on every `push` event to the `main` branch. It points to our routing layer.
- Serverless Function (AWS Lambda/Google Cloud Function): A small Python function is set up to receive the webhook. It’s cheap, scalable, and requires zero server management.
- The Logic: The function’s job is to parse the JSON payload from GitHub, find the commit message, and use a regular expression to extract the Jira ticket ID. If no ID is found, it exits silently. If an ID is found, it constructs an API call to the Jira REST API.
- Jira API Call: The function authenticates to Jira using a stored API token and makes a `POST` request to transition the ticket `PROJ-451` to the “Ready for QA” status. It can also add a comment with a link back to the exact commit.
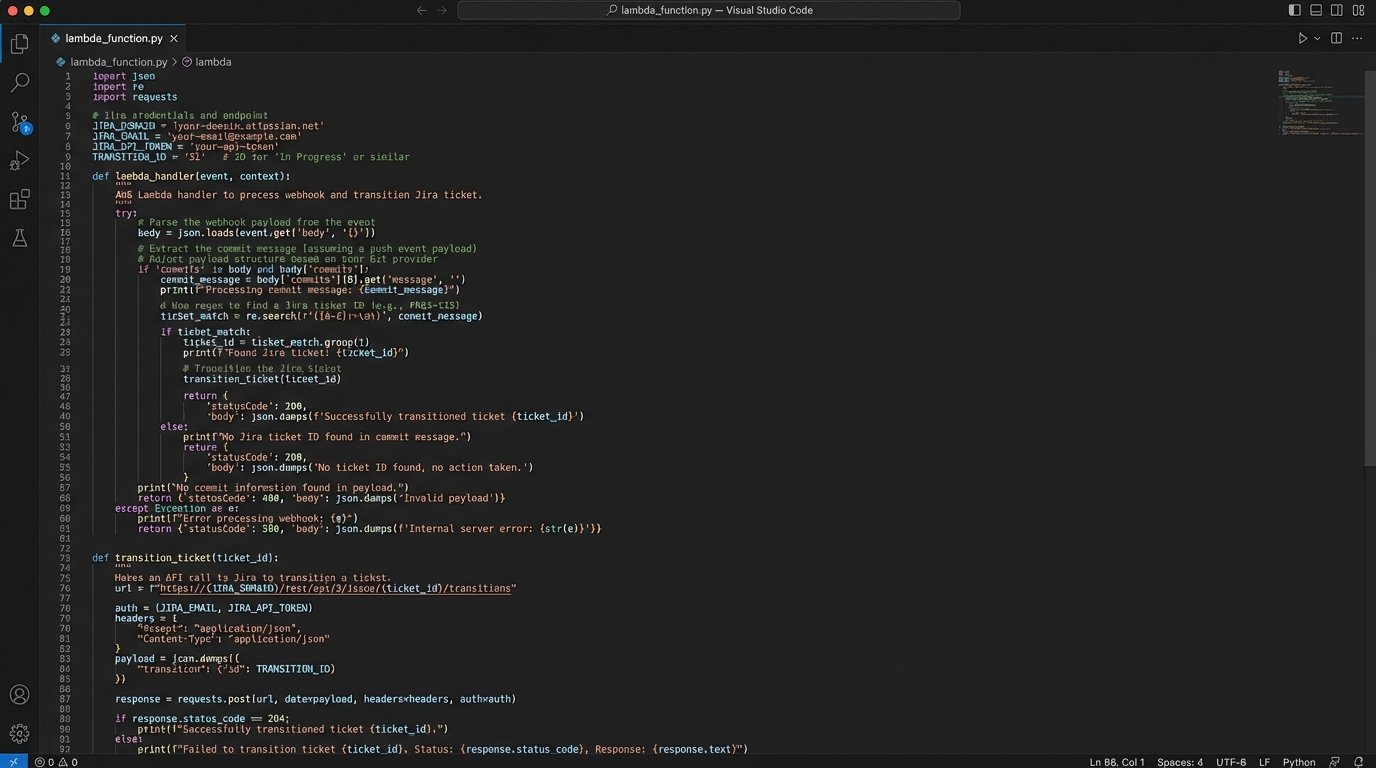
Here is a stripped-down Python example of what that Lambda function’s core logic might look like, using the `requests` library.
import os

import re

import json

import requests
JIRA_URL = "https://your-domain.atlassian.net"
JIRA_EMAIL = os.environ.get("JIRA_EMAIL")
JIRA_TOKEN = os.environ.get("JIRA_TOKEN")
TRANSITION_ID = "31" # ID for "Ready for QA" transition in your Jira workflow
def handler(event, context):
body = json.loads(event.get("body", "{}"))
# Simple check to see if it's the main branch
if body.get("ref") != "refs/heads/main":
return {"statusCode": 200, "body": "Not main branch, skipping."}
# Find commit message
try:
commit_message = body["head_commit"]["message"]
except (KeyError, TypeError):
return {"statusCode": 400, "body": "Could not parse commit message."}
# Extract Jira ticket ID
match = re.search(r"\[([A-Z]+-\d+)\]", commit_message)
if not match:
return {"statusCode": 200, "body": "No Jira ticket found in commit."}
ticket_id = match.group(1)
# Call Jira API to transition ticket
api_url = f"{JIRA_URL}/rest/api/3/issue/{ticket_id}/transitions"
auth = (JIRA_EMAIL, JIRA_TOKEN)
headers = {"Accept": "application/json", "Content-Type": "application/json"}
payload = json.dumps({"transition": {"id": TRANSITION_ID}})
try:
r = requests.post(api_url, headers=headers, data=payload, auth=auth)
r.raise_for_status() # Raises an HTTPError for bad responses (4xx or 5xx)
except requests.exceptions.RequestException as e:
print(f"Error transitioning ticket {ticket_id}: {e}")
return {"statusCode": 500, "body": "Failed to call Jira API."}
return {"statusCode": 204}
This single, small piece of automation eliminates a manual step, ensures consistency, and creates an audit trail connecting the code change directly to the project management ticket.
The Inevitable Problems: Fatigue and Maintenance
This is not a zero-cost abstraction. Architecting a notification system introduces a new piece of infrastructure that must be maintained. Ignoring this reality is how “helpful automation” decays into “technical debt.”
The first problem is alert fatigue. If every pipeline run, successful or not, sends a message, the channel becomes useless. The routing logic must be ruthless. It needs rules for aggregation. For example, instead of an alert for every failing commit on a feature branch, send one summary report every hour. For the main branch, alert on the first failure immediately, but then suppress subsequent failure alerts for the next 15 minutes to avoid a storm during a frantic fix attempt.
The second problem is ownership. Who fixes the Lambda function when Jira changes its API authentication method? Who updates the webhook signature validation key when it’s rotated? This system must be treated like any other production service. It needs monitoring, logging, and a designated owner or on-call rotation. Without clear ownership, it will break, and the old, broken manual processes will creep back in.
Security is another non-negotiable. A webhook endpoint is a publicly accessible URL. A malicious actor could flood it with fake payloads. At a minimum, every handler must validate the payload signature provided by the source system (e.g., GitHub’s `X-Hub-Signature-256` header). This check ensures the request is authentic and hasn’t been tampered with. It’s the difference between a secure system and an open door.
Machine-to-Machine Communication Is the Real Goal
Human-facing alerts are only the first step. The real leverage comes from having your systems talk directly to each other. The goal is to create a rich, contextual data stream that your observability and deployment platforms can consume automatically. This is about injecting context, not just sending messages.
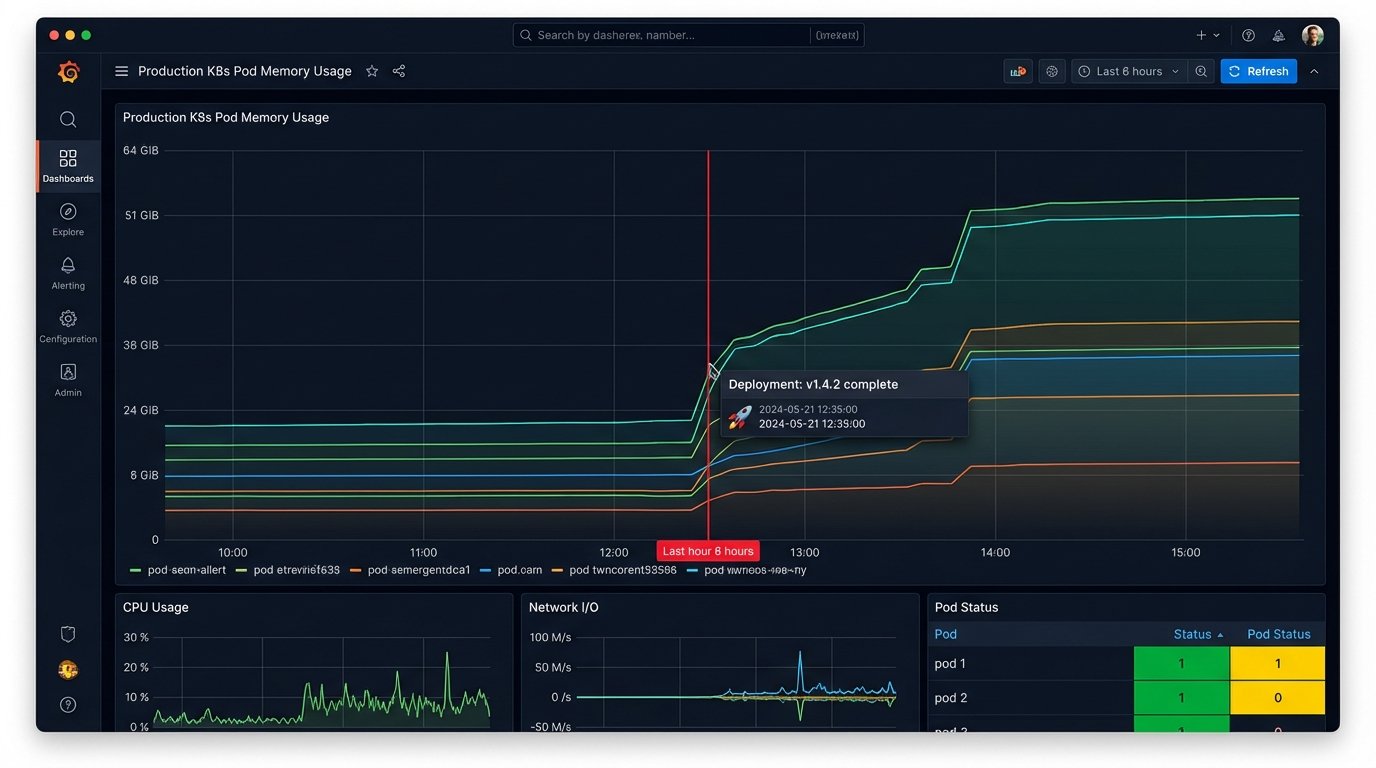
Consider a deployment pipeline for a microservice. When a new version is successfully deployed to production, the final step in the pipeline should be a webhook call to your monitoring platform, like Datadog, New Relic, or Grafana. This call creates a deployment event marker, an annotation that appears as a vertical line on every dashboard graph related to that service.
The result is powerful. If the new code introduces a memory leak, you will see memory usage start to climb on the graph precisely at the point of the deployment marker. If latency spikes, you can immediately correlate it to the code change. This eliminates guesswork. The SRE team no longer needs to ask, “Did anything change around 3:15 PM?” The system of record tells them exactly what changed and when. You are shoving a firehose of operational context directly into your monitoring tools.
This closes the loop between cause and effect. Instead of relying on humans to cross-reference timestamps between a deployment log and a metrics dashboard, the machine does it for them. The communication is no longer a chat message; it is a piece of structured metadata attached to a time series.
Building these automated systems is not about removing human communication. It is about elevating it. It forces communication to be structured, immediate, and auditable. It frees up engineering time from repetitive status updates and manual investigation, allowing them to focus on the problems that actually require creative thought. The cost of miscommunication is not a missed Slack message. It is the collective hours of high-value engineering time wasted diagnosing preventable problems.