The Spreadsheet That Runs a Billion Dollar Portfolio
Corporate real estate portfolios are not run on sophisticated, integrated platforms. They are run on a nightmare patchwork of decade-old ERPs, disconnected CRMs, and one master Excel spreadsheet that a single person in finance understands. This spreadsheet is the single point of failure for asset management, leasing pipelines, and capital planning. The core problem is data inertia. Information is locked in proprietary formats and requires manual intervention to move, leading to stale reports and flawed forecasting.
Attempts to fix this usually involve a “rip and replace” strategy. Management signs a seven-figure check for a monolithic IWMS platform, expecting a seamless transition. Six months later, the project is a mess. The new system cannot handle the undocumented exceptions and custom fields from the old one, and the team reverts to the old spreadsheet because they have deadlines to meet.
Deconstructing the Legacy Stack
The typical CRE tech stack is an archeological dig. At the bottom layer, you find a financial system of record, maybe an old version of Yardi or MRI, that handles accounting and rent rolls. This system is stable but inflexible. Its API is either non-existent or a poorly documented SOAP endpoint that returns cryptic XML. Getting data out is the first major bottleneck.
Above that sits a collection of disconnected tools. Leasing teams use their own CRM. Property managers have a separate work order system. The capital projects team tracks budgets in, you guessed it, more spreadsheets. Each system is a data island. The only bridge between them is a series of recurring calendar invites for a “data sync meeting” where people manually reconcile numbers. This process is slow, prone to human error, and completely unscalable.
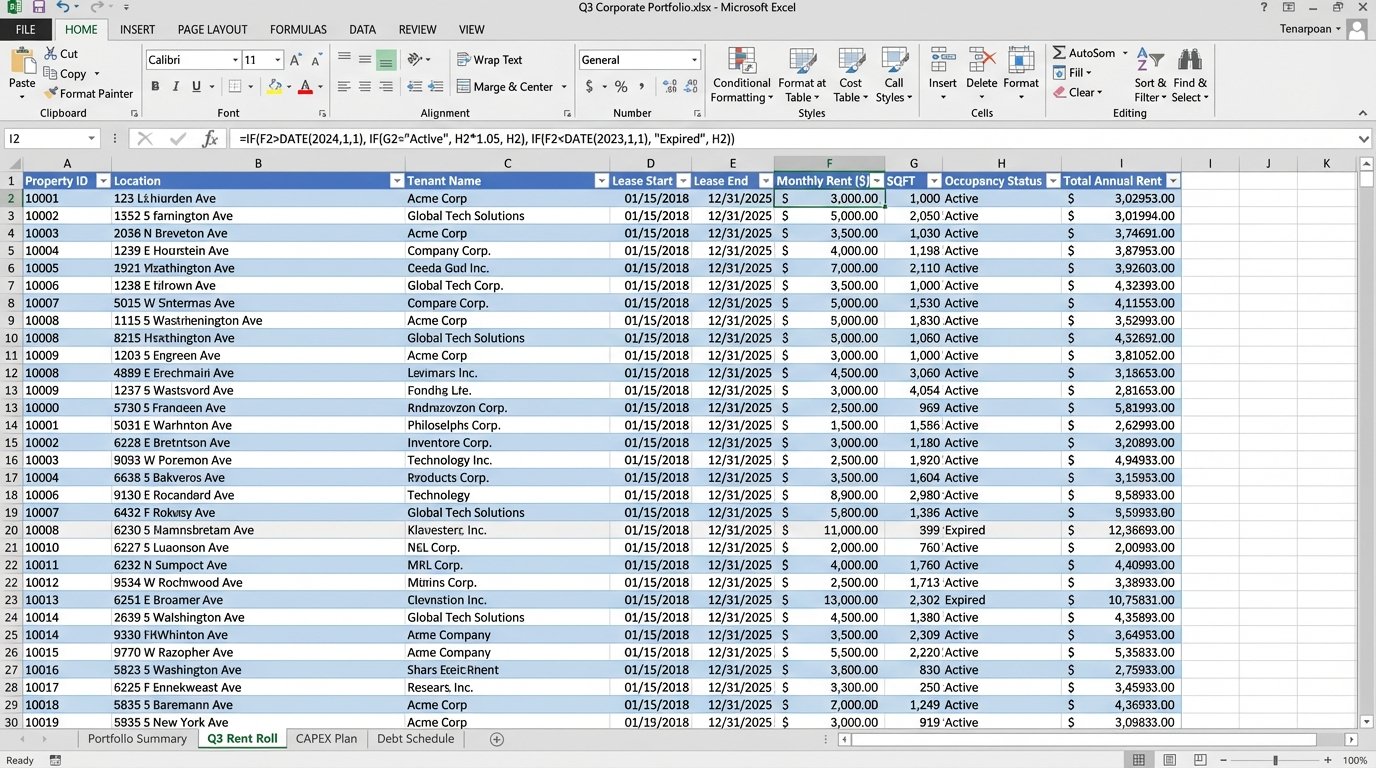
The technical debt accumulates with every manual workaround. Someone writes a VBA macro to format a report. That macro becomes mission-critical. When the person who wrote it leaves, nobody knows how to maintain it. The entire reporting function is now dependent on a fragile piece of code running inside a single XLSX file. This isn’t a stable architecture. It is a house of cards waiting for a breeze.
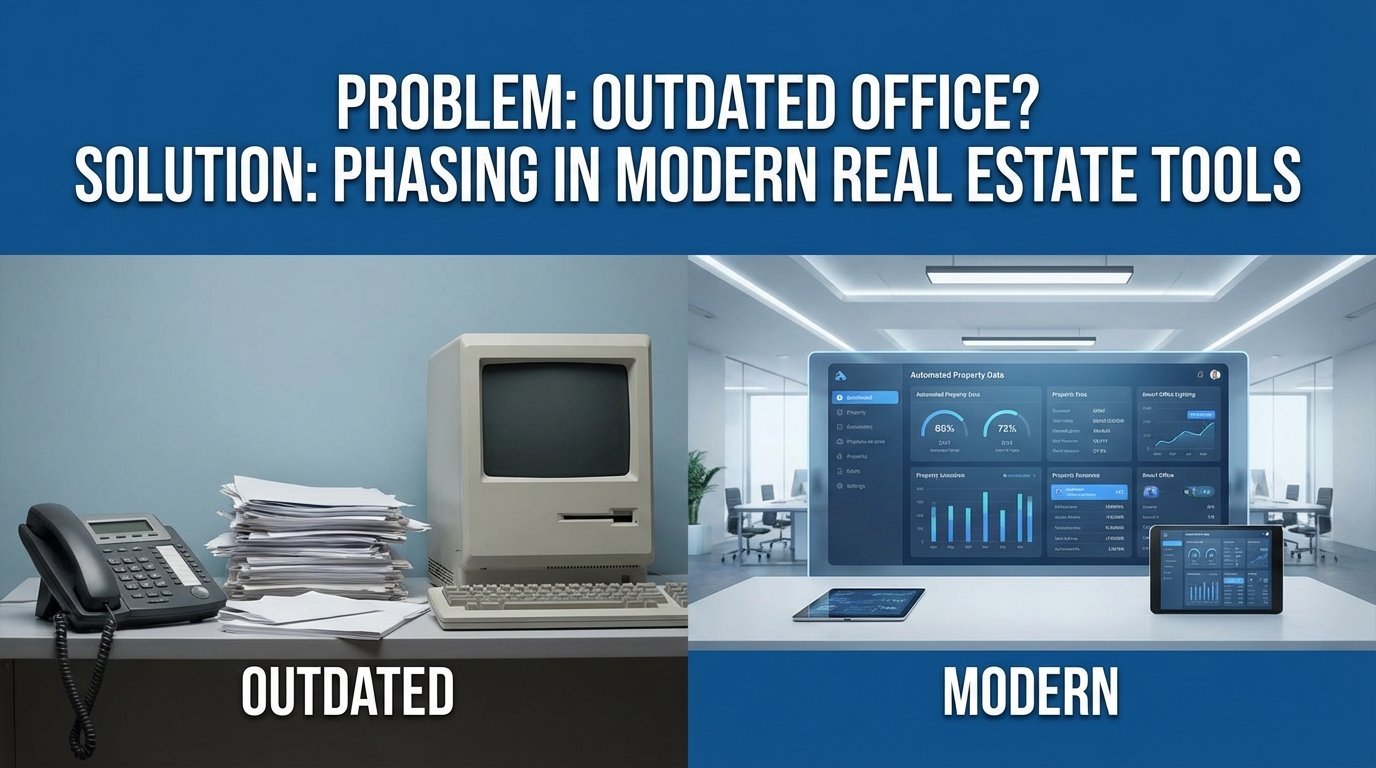
A Phased Approach: APIs as the Scaffolding
The alternative to a failed “rip and replace” is a gradual phase-in of modern tools built around an API-first methodology. Instead of trying to change everything at once, we build bridges between existing systems. The goal is to automate data extraction and create a centralized, clean data source that new applications can consume. This is slower, less dramatic, but it actually works.
This strategy treats data flow like plumbing. You have old, corroded pipes (legacy systems) and you want to install new, efficient fixtures (modern tools). You don’t shut off the water to the whole building and tear out all the walls. You systematically bypass and replace one section at a time, ensuring the water keeps running. This is the only way to execute a migration without grinding business operations to a halt.
Phase 1: Extraction and Normalization
The first job is to get the data out. Forget direct database connections. They are a security risk and often violate support agreements with the legacy vendor. The most reliable method is often the simplest: automated report generation. We can script the legacy system to export its standard reports as CSV or XLSX files to a designated network share or cloud storage bucket on a schedule.
Once the files are accessible, a script can pick them up, parse them, and normalize the data. Python with the pandas library is the standard for this. The script strips unnecessary headers, corrects data types, renames columns to a consistent convention, and flags missing or obviously incorrect values. This cleaned data is then loaded into a staging database, a simple PostgreSQL or SQL Server instance will do.
import pandas as pd
def normalize_lease_data(file_path):
# Load the raw CSV export
df = pd.read_csv(file_path, skiprows=4)
# Define a mapping for column renaming
column_map = {
'Lease ID': 'lease_id',
'Tenant Name': 'tenant_name',
'Commencement Dt.': 'start_date',
'Expiration Dt.': 'end_date',
'Monthly Rent ($)': 'monthly_rent_usd'
}
df.rename(columns=column_map, inplace=True)
# Force correct data types
df['start_date'] = pd.to_datetime(df['start_date'], errors='coerce')
df['end_date'] = pd.to_datetime(df['end_date'], errors='coerce')
df['monthly_rent_usd'] = pd.to_numeric(df['monthly_rent_usd'], errors='coerce')
# Drop rows with critical missing data
df.dropna(subset=['lease_id', 'start_date', 'end_date'], inplace=True)
return df
# Example usage
# cleaned_data = normalize_lease_data('//network_share/exports/rent_roll_q3.csv')
# print(cleaned_data.head())
This script is not complex. It is however, robust. It logic-checks the data at the point of ingestion, preventing bad data from polluting the new systems we intend to connect later. This clean, staged data becomes the “single source of truth,” replacing the master spreadsheet.
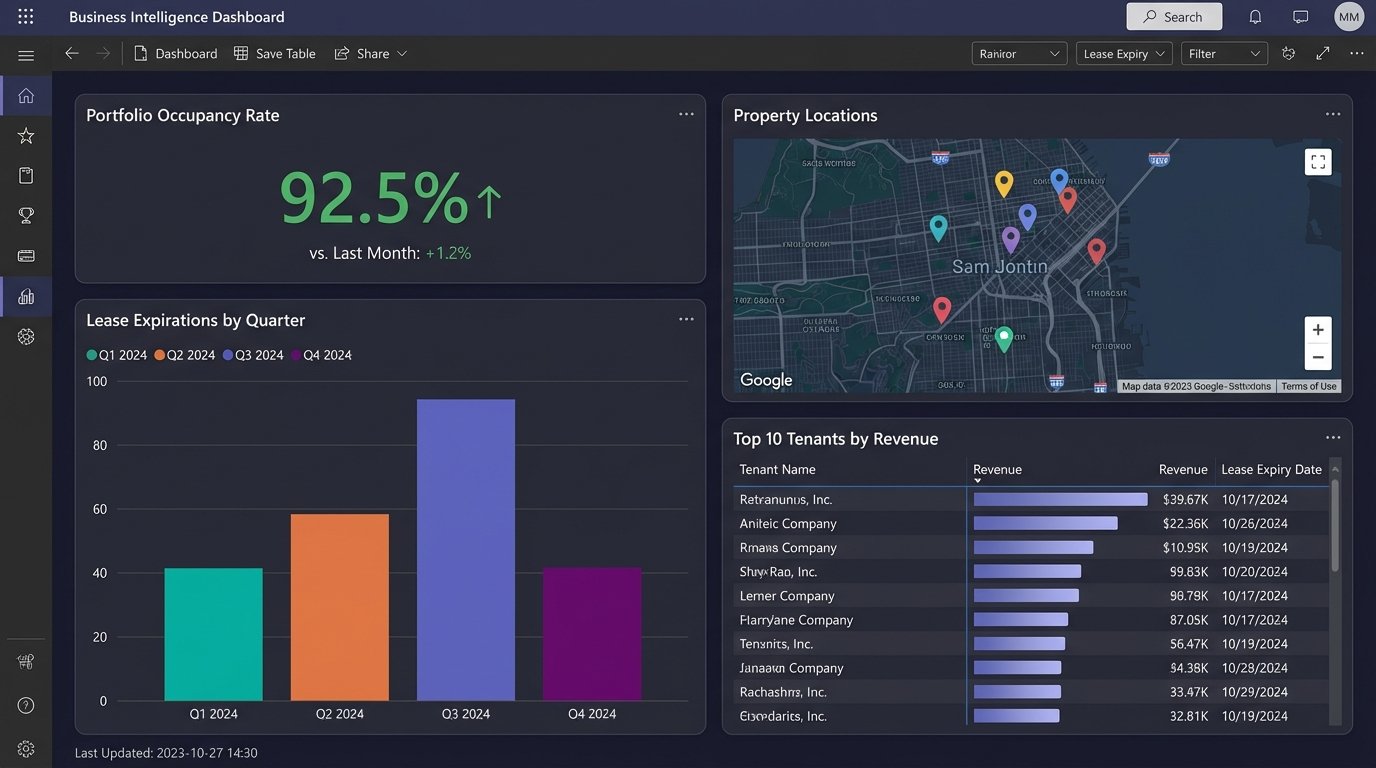
Phase 2: Connecting the New Tools
With a clean data source established, we can start plugging in modern tools. A common first step is connecting a business intelligence platform like Tableau or Power BI. This provides immediate value by allowing for the creation of interactive dashboards for portfolio analysis, lease expiration tracking, and occupancy forecasting. The BI tool queries the staging database directly, so the dashboards are always up to date with the latest extracted data.
The next step is to introduce specialized applications. For example, a modern leasing and asset management platform like VTS. Instead of forcing users to manually enter data into two systems, we use the new platform’s API to push data from our staging database. This could be a nightly batch process that updates lease records or tenant information.
This is where API quality matters. A well-documented REST API with predictable JSON payloads makes this task straightforward. A poorly designed one turns it into a reverse-engineering project. Always check the API documentation and rate limits before selecting a new vendor. A tool without a usable API is just another data silo waiting to happen.
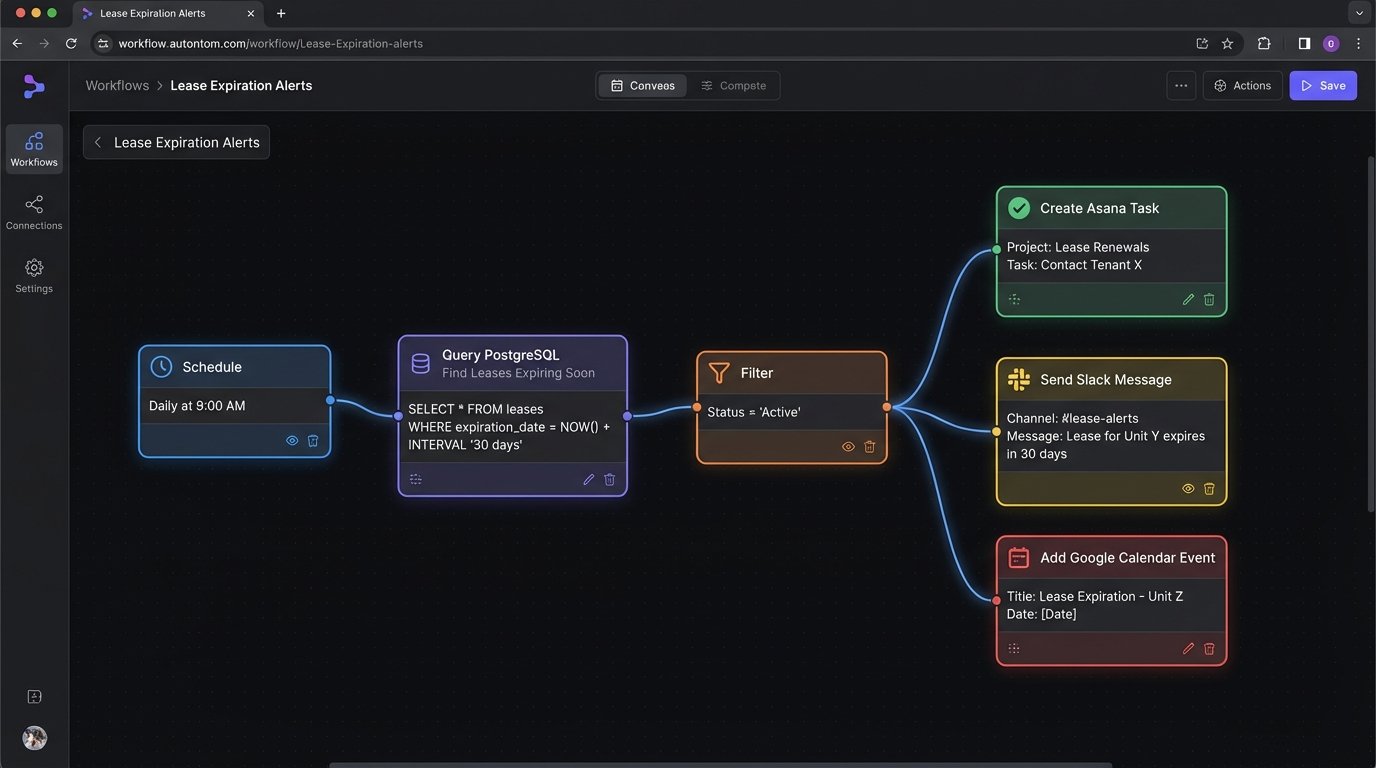
Phase 3: Automating Actions and Workflows
The final phase is to move from passive data aggregation to active automation. We can build workflows that trigger actions based on data changes. This is where middleware platforms like Zapier, or more powerful enterprise tools like Azure Logic Apps or AWS Step Functions, come into play. These tools can listen for events and orchestrate calls between different APIs.
A simple example is a lease expiration alert. A daily job queries the staging database for leases expiring in the next 90 days. For each expiring lease, the workflow can:
- Create a task in the leasing team’s project management tool (e.g., Asana, Jira).
- Send a notification to a designated Slack channel.
- Add a calendar event to the asset manager’s calendar.
This automates a previously manual monitoring task. It reduces the risk of missing a critical date and frees up the team to focus on negotiating renewals instead of checking spreadsheets. The same principle applies to financial reporting, maintenance scheduling, and compliance tracking.
Building these workflows requires thinking about state management and error handling. What happens if an API call fails? The workflow needs a retry mechanism with exponential backoff. What happens if a duplicate event is received? The logic needs to be idempotent, meaning it can safely run multiple times without creating duplicate records. These are not edge cases. They are guarantees in any distributed system.
The Real Costs and Limitations
This phased approach is not free. The primary cost shifts from a single large software license to ongoing development and subscription fees. Each new SaaS tool has a per-user monthly cost. API usage is often metered, and exceeding free tiers can get expensive. The custom scripts and workflows require maintenance. When a legacy system is updated, the extraction scripts might break. When a SaaS vendor changes their API, the integration workflows need to be updated.
There is also a talent cost. You need people who understand how to work with APIs, write resilient code, and manage cloud infrastructure. This is a different skillset from the traditional IT team that manages on-premise servers. Finding and retaining this talent can be a challenge.
The system’s performance is ultimately limited by its slowest part. If the legacy system can only export a report once every 24 hours, then your data will never be more real-time than that. This approach improves data quality and accessibility. It does not magically fix the underlying limitations of the old technology.
The goal is not to build a perfect, fully-automated system on the first attempt. The goal is to create a flexible architecture that allows for incremental improvement. By isolating legacy systems and communicating with them through well-defined interfaces, we gain the ability to swap out components over time without another catastrophic “rip and replace” project. You get control back piece by piece.