Every week, someone in your organization spends hours pulling data. They log into Google Analytics, Search Console, Google Ads, maybe a CRM, and a proprietary backend system. They export five different CSV files, paste them into a master spreadsheet, and fight with VLOOKUP until the charts look right. This isn’t data analysis. It’s manual, repetitive labor that introduces human error and consumes valuable engineering or analyst time.
The core failure is treating reporting as a series of manual tasks instead of an engineering problem. The process is fragile. One changed column name in an export breaks the entire spreadsheet. A holiday skews the manual date range selection. The result is inconsistent data, burnt-out analysts, and business decisions based on faulty numbers. This is a system designed to fail.
Architecting a Fix: The Data Pipeline
The solution is not a better spreadsheet template. The solution is to build a pipeline that automates the entire workflow: extraction, transformation, and loading. You build it once, monitor it, and let it run. This approach forces a clean separation of concerns and creates a reliable, single source of truth for your key metrics. Forget the manual grind. We architect a system.
The pipeline consists of three distinct stages. First, we programmatically extract raw data from source APIs. Second, we sanitize, reshape, and join this data in a staging area. Third, we load the clean, aggregated data into its final destination, whether that’s a database, a data warehouse, or a business intelligence tool. Each stage must be robust and decoupled from the others.
Thinking about this process as a single monolithic script is a common mistake. You need to build a system where the failure of one part, like a downed API, doesn’t corrupt the entire dataset. It should log the error, alert you, and ideally, be able to retry the failed job later.
Stage 1: Extraction via API
Stop exporting CSVs. Every modern analytics platform has a REST API. Your first task is to write scripts that connect to these endpoints and pull raw data. This is the foundation of the entire system. Your primary tools here will be scripts written in a language like Python, using libraries like Requests for HTTP calls and handling authentication.
Authentication is often the first hurdle. Most major platforms use OAuth 2.0, which requires a multi-step flow to get an access token. You’ll need to generate credentials, handle the token refresh logic, and store your keys securely. Never hard-code credentials directly in your scripts. Use environment variables or a proper secrets management system.
A typical extraction script targets a specific endpoint, passes parameters for date ranges and metrics, and paginates through the results. Most APIs limit the amount of data returned in a single call. Your script must be built to handle this, making subsequent calls with a page token or offset until all data is retrieved. Neglecting pagination is how you end up with incomplete datasets.
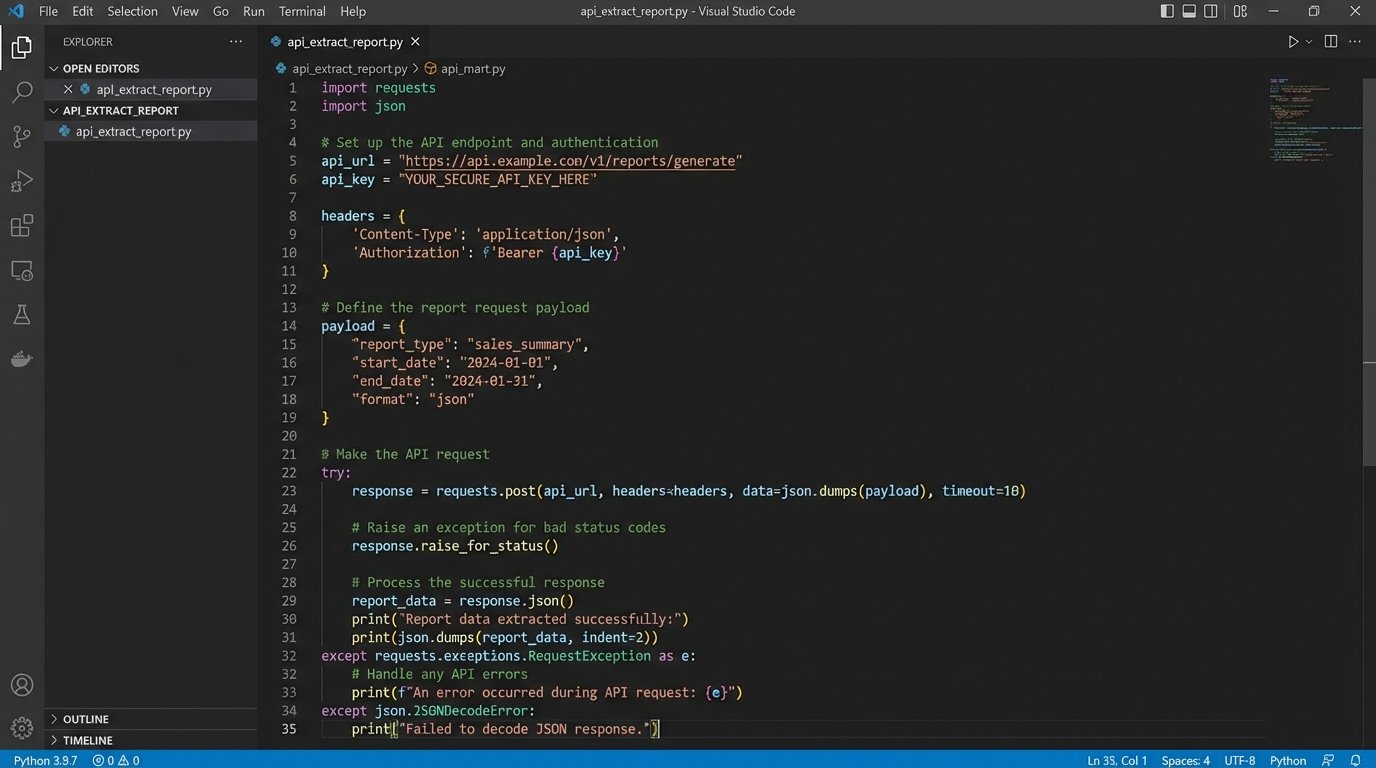
Here is a bare-bones Python example for hitting a generic API endpoint. It is not production-ready. It lacks proper error handling, retry logic, and secure credential management, but it demonstrates the basic mechanics of making a request and handling a JSON response. The point is to bypass the user interface entirely.
import requests

import json

import os
# Credentials should be stored as environment variables, not here.
API_KEY = os.environ.get('MY_API_KEY')
API_ENDPOINT = 'https://api.example.com/v4/reports'
headers = {
'Authorization': f'Bearer {API_KEY}',
'Content-Type': 'application/json',
}
payload = {
'reportRequests': [
{
'viewId': '12345678',
'dateRanges': [{'startDate': '7daysAgo', 'endDate': 'today'}],
'metrics': [{'expression': 'ga:sessions'}],
'dimensions': [{'name': 'ga:date'}]
}
]
}
try:
response = requests.post(API_ENDPOINT, headers=headers, data=json.dumps(payload))
response.raise_for_status() # Raises an HTTPError for bad responses (4xx or 5xx)
data = response.json()
print("Data extracted successfully.")
# Next step: pass this 'data' object to the transformation stage.
except requests.exceptions.HTTPError as errh:
print(f"Http Error: {errh}")
except requests.exceptions.ConnectionError as errc:
print(f"Error Connecting: {errc}")
except requests.exceptions.Timeout as errt:
print(f"Timeout Error: {errt}")
except requests.exceptions.RequestException as err:
print(f"Something else went wrong: {err}")
Rate limiting is another reality. Hammer an API with too many requests in a short period, and it will lock you out with a 429 status code. A well-built extraction script respects the API’s limits. It includes logic to handle these responses, typically by implementing an exponential backoff strategy where the script pauses for a progressively longer time before retrying the request.
Stage 2: The Transformation Mismatch
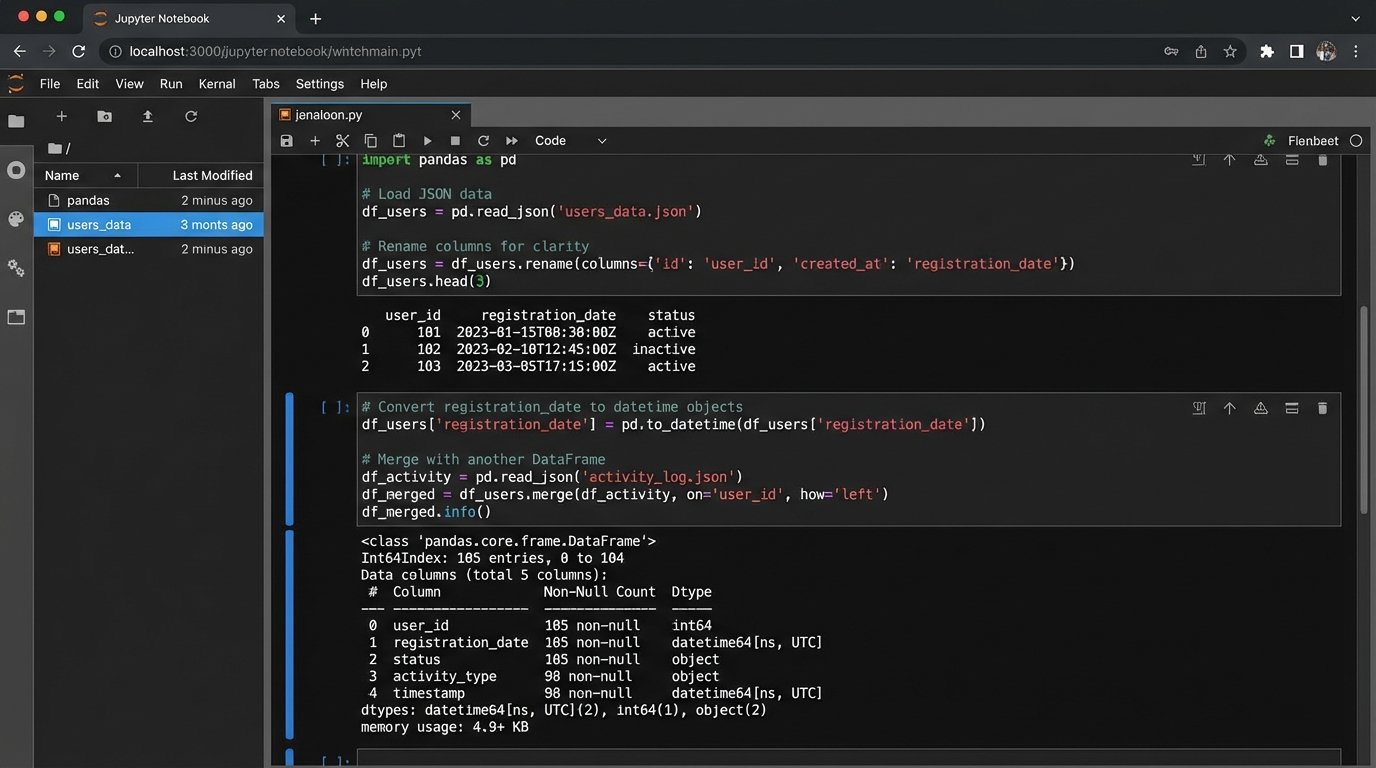
Raw data from an API is rarely usable. It arrives as nested JSON with inconsistent naming conventions and data types. The transformation stage is where you impose order. You strip away unneeded fields, cast strings to integers or dates, and normalize column names. For instance, one API might call it `user_id` while another calls it `uid`. You must standardize this.
This stage is like shoving a firehose through a needle. You have a massive, messy stream of data coming in and you need to force it into a clean, structured format before it can go any further. This is arguably the most critical and complex part of the entire pipeline, where data integrity is either preserved or lost.
Joining data from different sources is the main event here. You might need to combine cost data from your ad platform with conversion data from your internal database. This requires a common key to join on, like a transaction ID or a date. If no common key exists, your data is effectively siloed, and the whole exercise is pointless. This logic check must happen before you write a single line of code.
Python with the Pandas library is the industry standard for this kind of in-memory data manipulation. You load your raw JSON or lists of dictionaries into a DataFrame, then perform cleaning, merging, and aggregation operations. The output of this stage should be a clean, tabular dataset, ready for loading.
- Cleaning: Remove null values, correct data types (e.g., ‘2023-10-26’ from a string to a datetime object), and handle outliers.
- Normalization: Standardize column headers and values across all data sources (e.g., ensure ‘Google’ and ‘google’ are treated as the same traffic source).
- Enrichment: Join the primary dataset with other sources to add context. For example, joining ad performance data with CRM data to map campaign spend to actual sales revenue.
Stage 3: Loading and Visualization
The final step is to load your transformed data into a destination. The destination dictates the method. For simple needs, you can use the Google Sheets API to push the data directly into a worksheet. This provides a familiar interface for non-technical stakeholders, but it’s not scalable for large datasets.
A better destination is a proper database, like PostgreSQL, or a cloud data warehouse like BigQuery or Snowflake. Loading data into a SQL database allows for more complex queries and historical analysis. Your script will connect to the database and perform an `INSERT` or, more intelligently, an `UPSERT` (update existing records, insert new ones) operation to avoid data duplication on subsequent runs. This makes your pipeline idempotent, a critical feature for reliability.
The visualization tool sits on top of this final data source. Tools like Looker Studio, Tableau, or Power BI connect directly to your database or data warehouse. Because the data they receive is already clean and aggregated, the dashboards are simpler to build and maintain. The logic lives in your pipeline, not in a dozen complex calculated fields within the BI tool. This decouples your data processing from your presentation layer.

Choosing Your Architecture: Build vs. Buy
You have two main paths to implement this pipeline: build a custom solution or buy an off-the-shelf ETL (Extract, Transform, Load) tool. Neither path is perfect.
The Build Path:
Writing your own scripts in Python and orchestrating them with a tool like Airflow or a simple cron job gives you maximum control and flexibility. The long-term cost is lower because you are not paying licensing fees. The downside is the significant upfront investment in engineering time. You are also responsible for all maintenance, including updating scripts when an API changes. This is the path for organizations with available engineering resources and a need for highly customized integrations.
The Buy Path:
Platforms like Fivetran, Stitch, or Supermetrics are wallet-drainers but offer pre-built connectors to hundreds of data sources. They handle the extraction and loading for you, reducing initial setup time from weeks to hours. The problem is you lose control. Their transformation capabilities can be limited, forcing you to work with their predefined schemas. You are also dependent on their roadmap for new connectors and are subject to their pricing models, which often scale with data volume.
There is no universally correct answer. The choice depends on your budget, your team’s skillset, and the complexity of your data sources. A hybrid approach is also common, using a commercial tool for standard connectors while building custom scripts for proprietary internal systems.
Maintenance and Error Handling: The System’s Immune Response
A pipeline that runs perfectly on day one will inevitably break. APIs change without notice. Credentials expire. A downstream system has an outage. A production-grade pipeline must anticipate failure and be designed for observability. Without robust logging and alerting, you are flying blind.
Every script execution should generate logs. At a minimum, log the start and end times, the amount of data processed, and any errors encountered. These logs should be written to a centralized location, not just printed to the console. When a job fails, the system must send an alert. A notification to a Slack channel or an email to a distribution list is essential. An error that no one knows about is a silent data corruption event waiting to happen.
Your pipeline must also be designed for recovery. If a job fails halfway through, can you rerun it without creating duplicate records? This is where idempotent design is critical. Using `UPSERT` logic when writing to a database ensures that rerunning a job corrects the state of the data instead of just appending more, incorrect rows.
Automated reporting is not a one-time project. It is a system that requires ongoing maintenance. But the effort shifts from mind-numbing manual data entry to high-value engineering work: improving system reliability, adding new data sources, and optimizing performance. You stop being a report generator and become a system architect.