The Failure of the Feature List
The conversation always starts the same. A VP asks you to justify spending five figures on a new monitoring platform. You forward the vendor’s PDF, packed with claims of “AI-powered anomaly detection” and “single-pane-of-glass visibility.” The request gets denied. Management sees a list of features, not a solution to a business problem. They see an expense, not an investment, because you failed to connect their wallet to your pain.
Relying on a vendor’s spec sheet is a career-limiting move. It signals that you haven’t done the groundwork. You haven’t quantified the problem you’re trying to solve. The real work isn’t finding the tool. It’s building the unassailable, data-driven case that makes the purchase an obvious financial decision. Without your own data, you’re just quoting marketing material. That’s a losing strategy.
Architecture of the Argument: Stop Guessing, Start Measuring
The only way to get a signature on a purchase order is to prove the cost of inaction is higher than the cost of the tool. This requires a shift from qualitative complaints like “the build is slow” to quantitative evidence like “CI pipeline latency costs us 210 developer hours per quarter.” To get there, you need to instrument your own problems first.
This process isn’t about building a data warehouse. It’s about a targeted extraction of metrics from the systems you already own. We’re looking for the points of friction that burn time and money. The goal is to build a simple dashboard that tells a story of operational drag. This is your evidence locker.
Phase 1: Instrument the Pain
First, identify the systems of record for your team’s biggest headaches. Don’t boil the ocean. Pick the top three sources of operational waste. Is it endless firefighting, broken deployments, or slow test cycles? The data lives somewhere. Your job is to rip it out.
- Ticketing Systems (Jira, ServiceNow): These are gold mines for quantifying toil. You can pull data on ticket volume for specific components, mean time to resolution (MTTR) for incidents, and the number of bugs reopened. The API is your entry point.
- CI/CD Platforms (Jenkins, GitLab CI, CircleCI): Every build generates data. Extract build durations, failure rates per branch, and the frequency of flaky tests. A high failure rate on the main branch is a direct tax on developer productivity.
- Log Aggregators (Splunk, ELK Stack, Datadog): Go beyond simple error counts. Build queries that correlate application error spikes with deployment events. Quantify how many critical errors a new release generates in its first hour. This links code changes directly to instability.
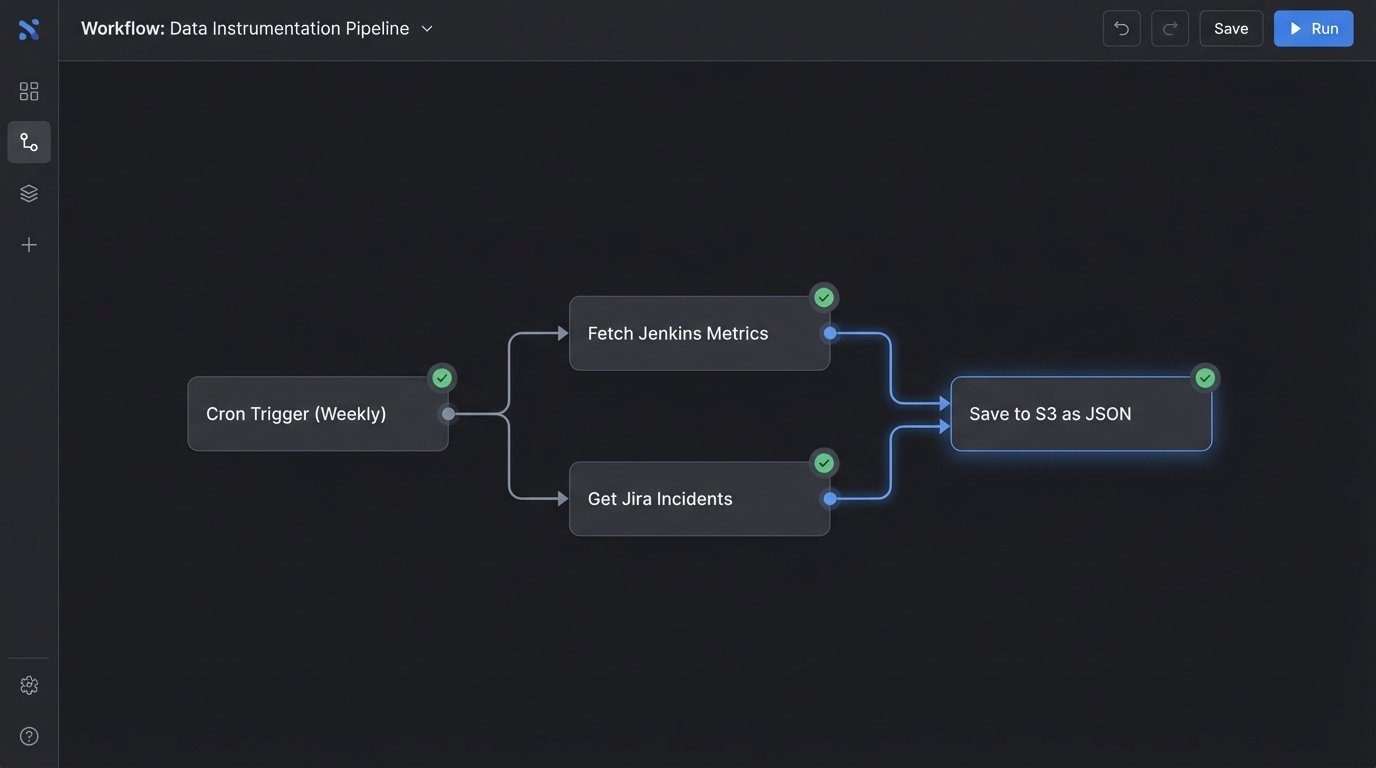
The key here is automation. A collection of cron jobs running Python scripts is good enough. You don’t need a real-time streaming platform. You need a consistent, weekly snapshot of your core operational metrics. Store the output as flat JSON or CSV files in a designated storage bucket. Keep it simple and reliable.
Phase 2: Aggregate and Correlate the Data
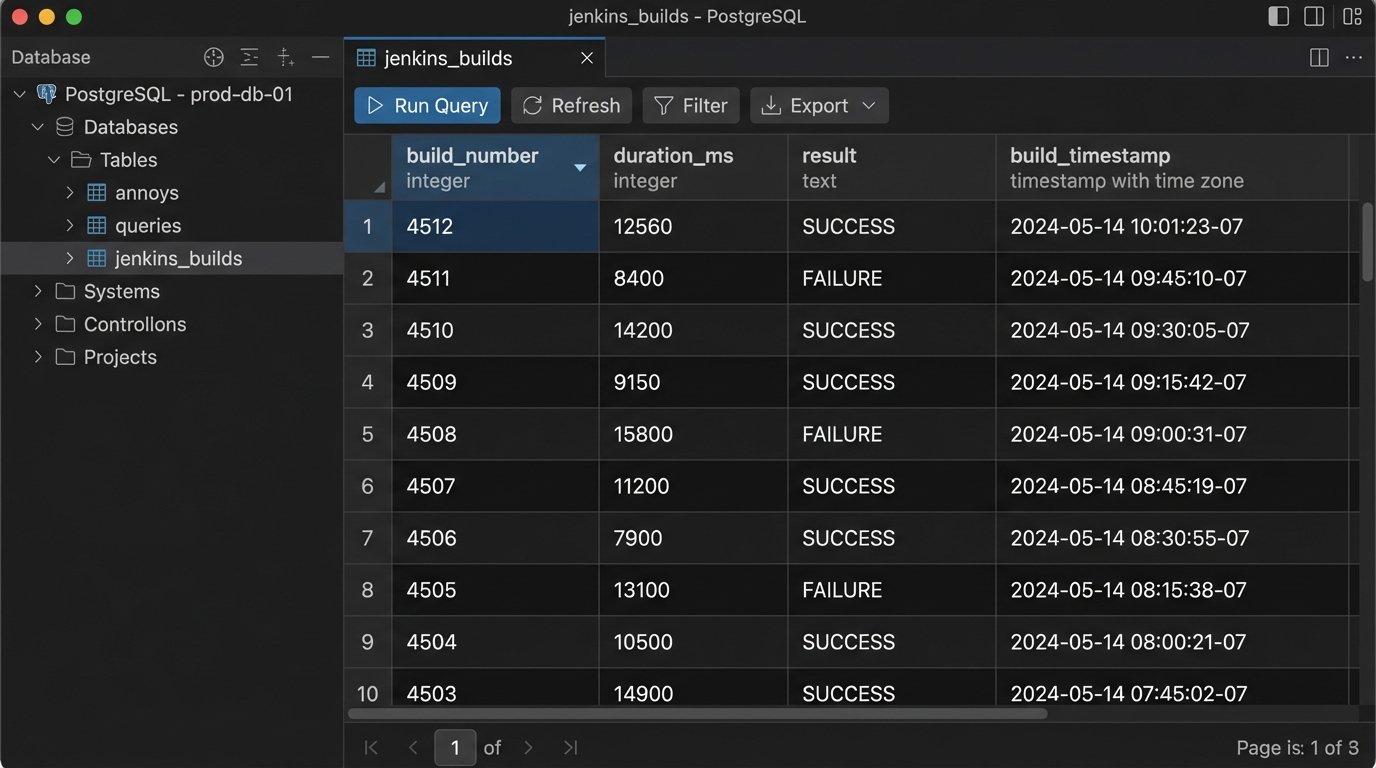
Once you have raw data streams, you need to centralize them. Trying to justify a purchase by showing a VP three different log files is amateur hour. The goal is a single source of truth that connects disparate metrics. A simple PostgreSQL database or even a local SQLite file can handle this for most teams. The important part is creating a unified schema.
For example, you can join deployment data from your CI tool with incident data from Jira using timestamps and release versions as keys. This lets you state facts like, “Deployments containing changes to the ‘authentication’ service account for 40% of all P1 incidents in the last six months.” That’s a powerful statement that a feature list can never make.
Trying to build this case without a central point for correlation is like trying to assemble a car with parts from three different factories and no blueprints. It’s a mess of disconnected components. You need to force them into a single, coherent structure to see how they interact.
A basic Python script can poll your storage bucket, parse the new JSON files, and inject the structured data into your database. This is a foundational piece of the architecture. It turns isolated metrics into relational intelligence.
import json
import psycopg2
import os

# WARNING: Example for illustration. Do not use hardcoded credentials in production.
DB_HOST = "your_db_host"
DB_NAME = "metrics_db"
DB_USER = "your_user"
DB_PASS = "your_password"

def parse_jenkins_data(file_path):
    """Parses a JSON file from Jenkins and returns structured data."""
    with open(file_path, 'r') as f:
        data = json.load(f)

    builds = []
    for build in data.get('builds', []):
        builds.append({
            'build_number': build.get('number'),
            'duration_ms': build.get('duration'),
            'result': build.get('result'),
            'timestamp': build.get('timestamp')
        })
    return builds

def load_to_postgres(build_data):
    """Connects to Postgres and inserts build data."""
    conn = None
    try:
        conn = psycopg2.connect(host=DB_HOST, dbname=DB_NAME, user=DB_USER, password=DB_PASS)
        cur = conn.cursor()

        # Simple INSERT, a real implementation would handle conflicts (UPSERT).
        insert_query = """
            INSERT INTO jenkins_builds (build_number, duration_ms, result, build_timestamp)
            VALUES (%(build_number)s, %(duration_ms)s, %(result)s, to_timestamp(%(timestamp)s / 1000.0))
        """

        for build in build_data:
            cur.execute(insert_query, build)

        conn.commit()
        cur.close()
        print(f"Successfully loaded {len(build_data)} records.")
    except (Exception, psycopg2.DatabaseError) as error:
        print(error)
    finally:
        if conn is not None:
            conn.close()

# Main execution logic
jenkins_file = 'path/to/your/jenkins_export.json'
if os.path.exists(jenkins_file):
    parsed_builds = parse_jenkins_data(jenkins_file)
    load_to_postgres(parsed_builds)
This script is not production-ready. It’s a starting point. It demonstrates the mechanical process of extracting data from a source file and forcing it into a structured, relational format. This is the grunt work that precedes any intelligent analysis.
Phase 3: Translate Metrics into Money
Engineers stop at the metric. Leaders need the financial translation. “P99 latency is 800ms” means nothing to the person signing the check. “Our slow checkout API is causing an estimated 3% cart abandonment rate, costing $25,000 in lost revenue per month” gets their attention. This is the most critical step.
Create a simple financial model. It doesn’t need to be perfect, just defensible. Use industry-accepted figures or internal numbers if you have them. Here’s a basic formula to calculate the cost of wasted engineering time:
Cost of Broken Builds = (Number of Failures / Week) x (Avg. Time to Fix in Hours) x (Avg. Engineer Hourly Cost) x (Number of Engineers Impacted)
Plugging in some numbers: (15 failures/week) x (0.5 hours/fix) x ($90/hour) x (4 engineers) = $2,700 per week, or over $140,000 per year. Suddenly, a $50,000 CI/CD analysis tool doesn’t look like an expense. It looks like a bargain.
Apply this logic to your other pain points:
- Incident Response: Calculate the cost of engineering hours spent in war rooms, based on MTTR data and the number of people on the call.
- Customer Churn: Correlate system downtime or performance degradation with customer support tickets or churn rates, if you can get that data from the business team.
- Inefficient Scaling: Analyze cloud provider bills to show money wasted on over-provisioned resources because you lack the visibility to scale efficiently. This is a wallet-drainer that gets immediate attention.
Phase 4: Build the Final Case
Your argument is now built on a foundation of your own operational reality. The final step is to present this data in a way that leaves no room for debate. The pitch is not about the new tool. It’s about the cost of maintaining the status quo.
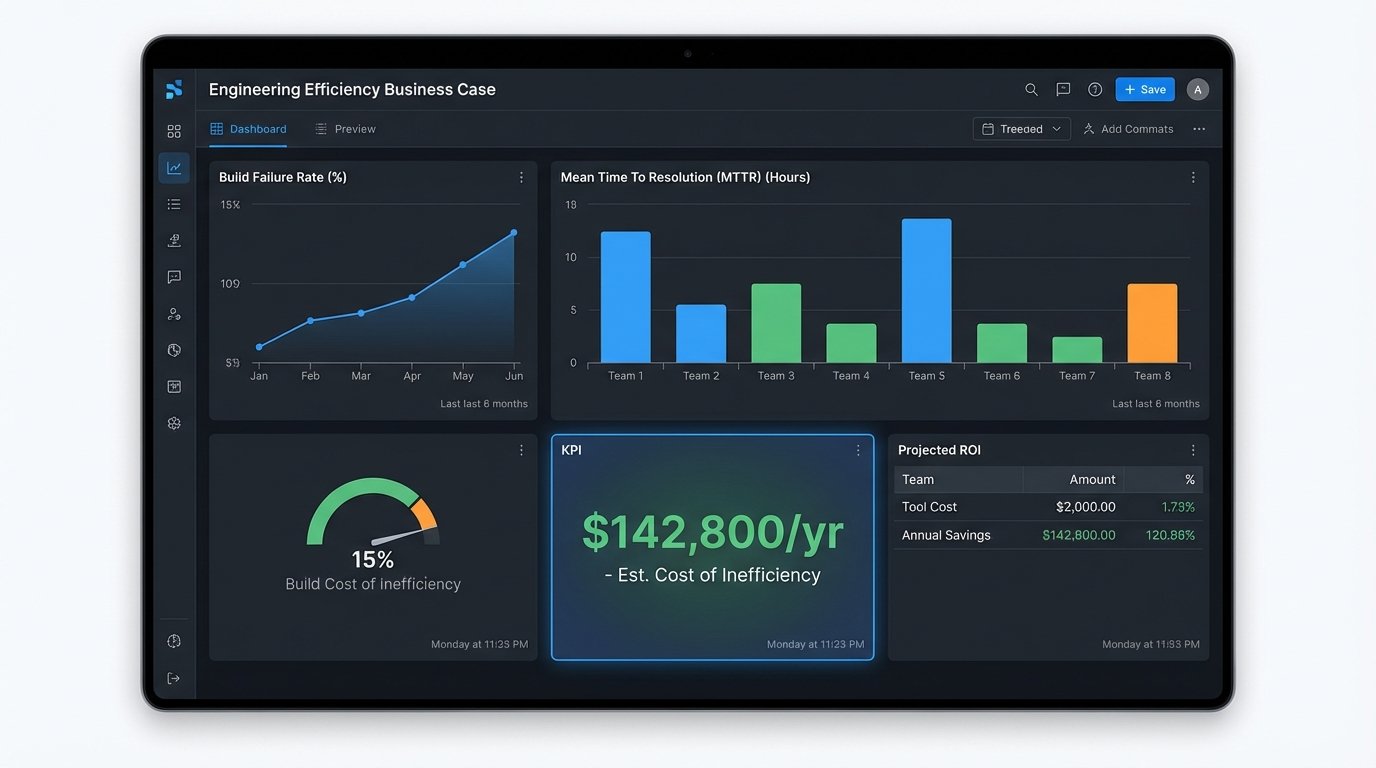
Create a one-page summary or a simple dashboard with three sections:
- The Problem in Numbers: Display your key metrics. Show the build failure rate trending up, the MTTR for incidents, and the calculated financial cost of this inefficiency over the last quarter. Use graphs. Make the pain visible.
- The Proposed Solution & Projected Impact: Briefly introduce the new tool. Do not list its features. State its expected outcome based on your data. For example: “We project Tool X will reduce build failures by 50% by identifying flaky tests pre-commit, saving an estimated $70,000 annually in wasted developer time.” Use the vendor’s case studies to source a realistic improvement percentage, but apply it to *your* cost model.
- The Financial Summary: A simple table showing the cost of the tool versus the projected savings. Include the payback period. (Cost of Tool) / (Projected Monthly Savings) = Months to Break Even. An executive can understand this in seconds.
This approach reframes the entire discussion. You are no longer asking for a new toy. You are presenting a data-backed business case for mitigating a quantified financial risk. It’s a fundamentally stronger position.
The upfront work is not trivial. You’ll need to negotiate for API keys, write some scrappy automation scripts, and build a simple data model. It takes discipline. But it’s the difference between having your request ignored and being seen as a strategic partner who connects technology to business outcomes.