The dashboard shows all green checkmarks. The high-level logs report success. Yet, the data in the target system is corrupt, missing, or just plain wrong. This is the quiet failure state that doesn’t trigger a single PagerDuty alert but costs hours of manual data cleanup. Troubleshooting these systems isn’t about reading a simple error message. It’s about forensic analysis of a silent breakdown.
We build these complex chains of triggers, API calls, and data transformations expecting them to be resilient. The reality is that they are brittle constructs, susceptible to everything from undocumented API changes to network latency hiccups. The key to fixing them quickly is having a systematic, skeptical approach that assumes nothing works as documented.
Isolate the Failure Domain First
A workflow with ten steps has at least ten points of failure, plus the connections between them. The first impulse is to blame the last step or the final API call. This is usually wrong. A failure in the final step is often a symptom of a data integrity issue introduced much earlier. You must surgically bisect the workflow to pinpoint the exact component that is misbehaving.
Stop looking at the entire execution log. Find a failed run and manually inspect the output of each step. Did Step 2 receive the expected payload from Step 1? Did the data transformation in Step 3 correctly handle a null value that came from Step 2? This manual, step-by-step trace is tedious. It is also the only reliable way to find the source of the problem instead of just patching a symptom downstream.
Think of it as disabling sections of an electrical circuit. If you turn off half the breakers and the problem disappears, you know where to look. Do the same with your workflow. Disable downstream steps and inspect the state of the data at the midpoint. This process forces you to find the root cause, not just the most obvious error message.
This is where your logging strategy shows its value or its weakness. If you aren’t logging the full data object at the beginning and end of each critical step, you are flying blind. You have no state to inspect.
Replicate with a Static Payload
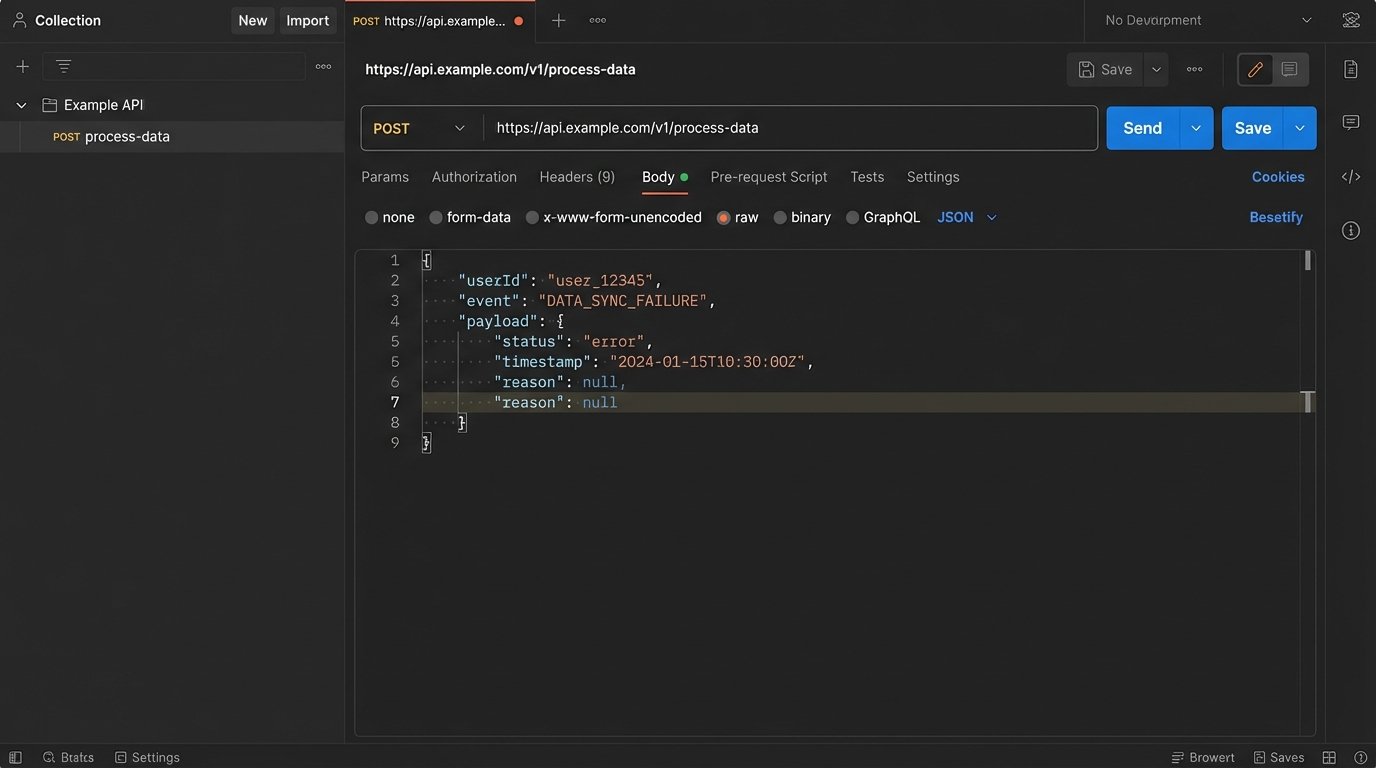
Live systems are noisy. A trigger might fire with a slightly different payload each time, making it impossible to consistently replicate a bug. The moment you identify a failed run, your first action should be to capture the exact input payload that caused it. This JSON, XML, or form data is now your ground truth for debugging.
With this static payload, you can bypass the live trigger mechanism entirely. You can use a tool like Postman, Insomnia, or a simple curl command to inject that payload directly into the specific step of the workflow that you suspect is failing. This removes all variables from upstream systems, network conditions, or trigger timing. You are now testing a single function with a known input.
If the step still fails, you’ve confirmed the issue is within that step’s logic. If it succeeds, the problem lies in the data’s state as it enters that step from a previous one. This simple act of decoupling the component from the live workflow is the fastest path to a diagnosis. It allows you to iterate on a fix without waiting for a new live event to trigger the entire process.
A basic curl command to test an endpoint with a captured JSON payload is a fundamental tool for this.
    curl -X POST 'https://api.example.com/v1/process-data' \

    -H 'Content-Type: application/json' \

    -H 'Authorization: Bearer your_api_key' \

    --data-raw '{

        "userId": 123,

        "event": "purchase_failed",

        "payload": {

            "orderId": "ord_abc123",

            "reason": null,

            "timestamp": "2023-10-27T10:00:00Z"

        }

    }'
This forces the bug out into the open, away from the complexity of the full system.
Distrust the API Contract
The API documentation is a well-intentioned guide that is often obsolete. Teams deprecate fields, change data types, or introduce new nested objects without updating their public-facing specs. Your workflow, which was built against that original contract, will start failing in subtle ways. A 200 OK status code means nothing if the response body is not what you expect.
Never assume a successful status code means a successful transaction. The server might return a 200 OK with an empty array where you expect an object, or a string value where you expect an integer. Your data mapping logic then injects this incorrect data type into the next step, causing a failure that seems completely unrelated to the API call that sourced the data.
You must programmatically validate the schema of every critical API response. This is not optional. Use a library like Zod for JavaScript or Pydantic for Python to define the expected structure of the incoming data. If the response does not match the schema, you force an immediate, explicit failure at the point of entry. This stops bad data from propagating through your system and creating confusing errors ten steps later.
This approach treats external APIs as fundamentally untrustworthy. It’s a zero-trust policy for data integration. This is like trying to shove a firehose of unstructured data through the needle of a well-defined schema. It forces messy, unpredictable API responses into a clean, reliable structure before your own logic ever touches it.
A simple validation check is not complicated to implement.
    // Simplified JavaScript example using Zod

    import { z } from "zod";
const UserSchema = z.object({
id: z.number().int(),
email: z.string().email(),
name: z.string().optional(),
});
function processApiResponse(apiData) {
const validationResult = UserSchema.safeParse(apiData);
if (!validationResult.success) {
// Data is invalid. Throw an error or send to a dead-letter queue.
console.error("API response schema validation failed:", validationResult.error);
throw new Error("Invalid data structure from User API.");
}
// Continue processing with validated data
const userData = validationResult.data;
console.log("Processing valid user:", userData.id);
}
This code prevents a missing email field or an ID sent as a string from silently breaking your business logic.
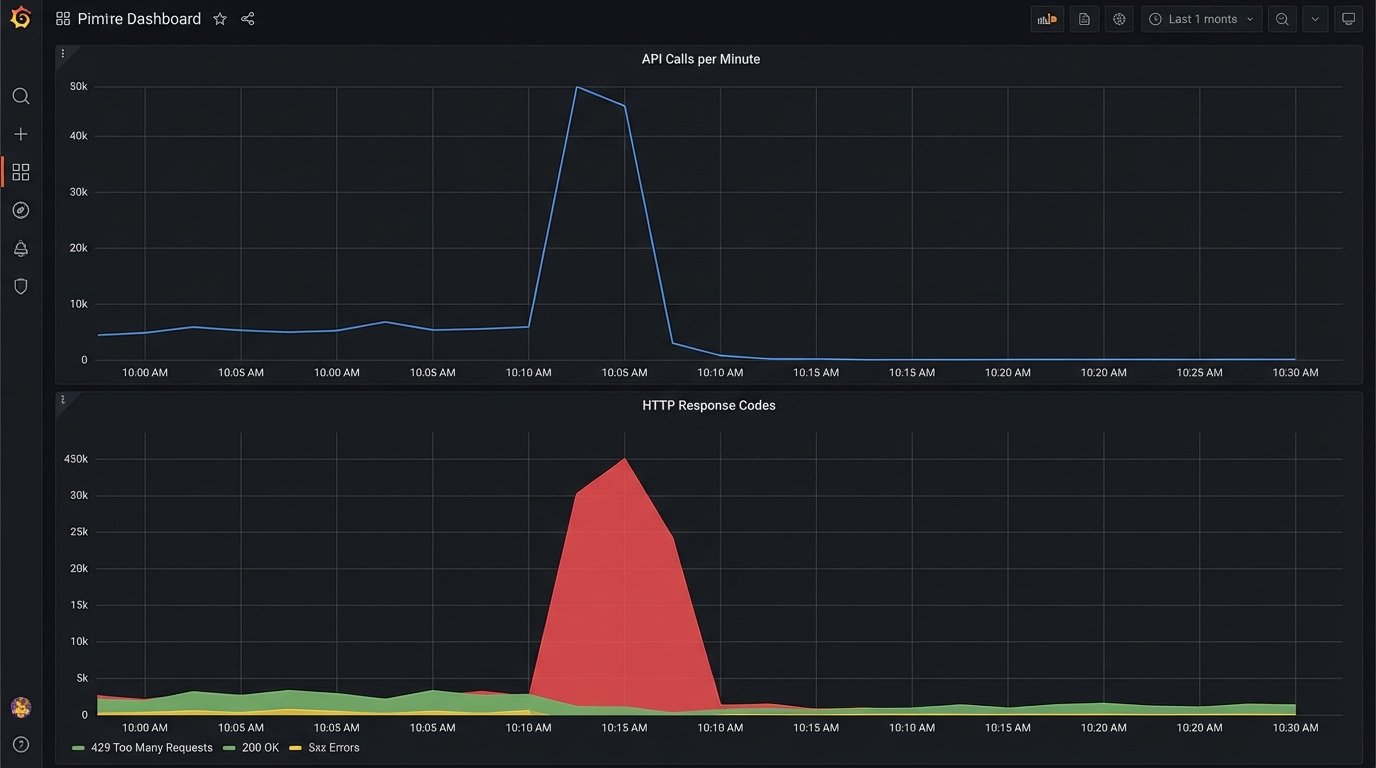
Rate Limits Are More Than a Number
When you see a 429 “Too Many Requests” error, the easy answer is to add a delay and retry. This is a naive fix. API providers implement rate limiting in complex ways. You need to know if you are dealing with a fixed window (1000 requests per hour), a sliding window, a concurrent request limit, or a resource-based limit where creating a user costs more “points” than reading one.
The documentation might give you a number, but the reality is often more nuanced. Some APIs have undocumented “burst” limits that allow a high volume of requests for a short period before throttling, and much lower sustained limits. Debugging these issues requires you to mimic your production traffic patterns. Hitting an API once a second in your test environment will not reveal a rate limit designed to stop 100 requests in a 10-second burst.
To properly troubleshoot, you must analyze the timing of your API calls in the moments leading up to the 429 error. Are you running a batch process that tries to sync 500 records at once? The solution isn’t just a simple delay, but a proper queueing system with controlled concurrency. You need to architect your workflow to smooth out the calls, respecting the API’s actual capacity, not just the number written in the docs.
A good practice is to read the rate limit headers sent back in the API response, such as X-RateLimit-Limit, X-RateLimit-Remaining, and X-RateLimit-Reset. Use this data to dynamically adjust the throughput of your system. If remaining requests are low, slow down. If the reset time is approaching, you can prepare to speed back up. This turns your client into an adaptive system, not a dumb one that just retries after a fixed interval.
Implement Idempotency from Day One
Network glitches, server errors, and timeouts happen. Automation platforms are designed to retry failed steps, which is good for resiliency. However, if the operation you are performing is not idempotent, a retry can create duplicate data, send multiple notifications, or charge a customer twice. A non-idempotent operation is a time bomb waiting in your workflow.
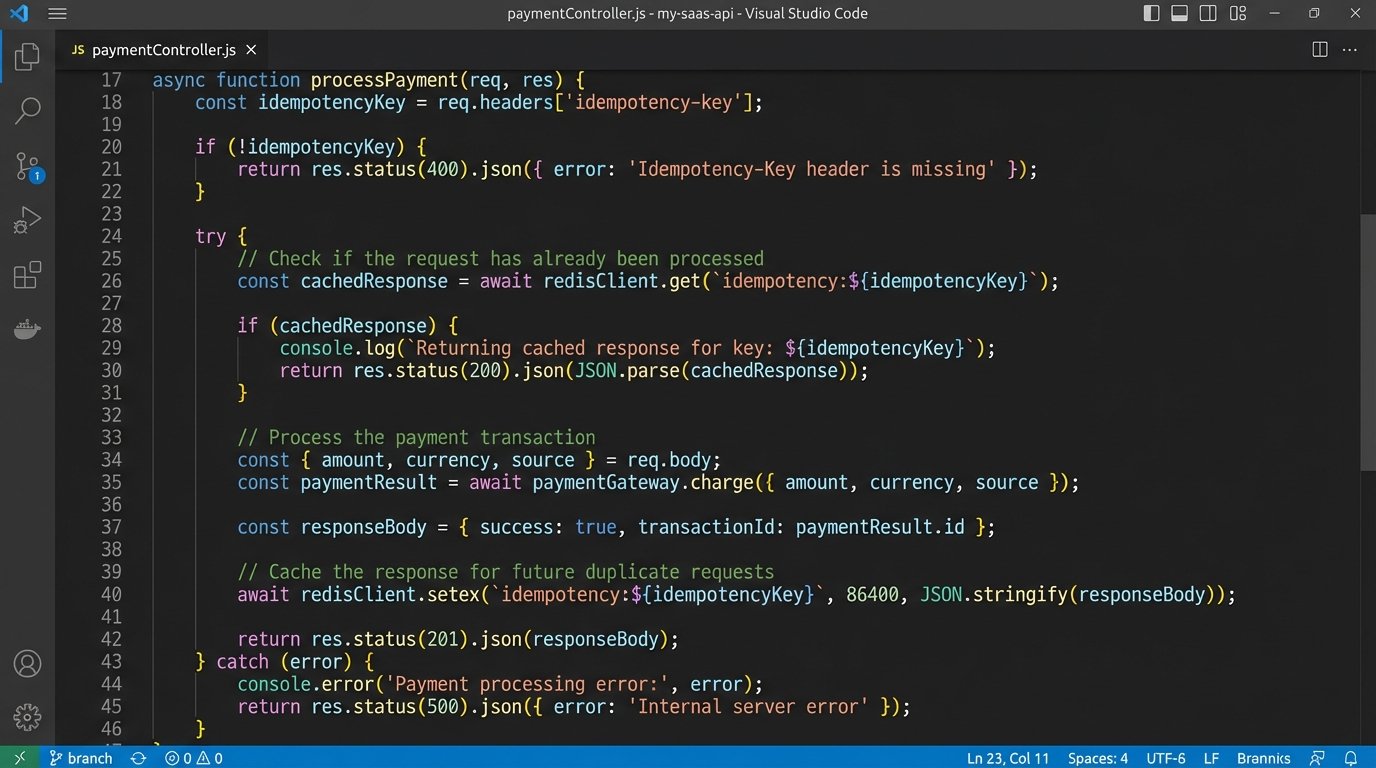
An idempotent operation is one that can be performed multiple times with the same input, yet only produces a single result. The classic example is a PUT request in REST APIs versus a POST. The fix for your workflows is to enforce idempotency even when the receiving API doesn’t support it natively.
You can achieve this by generating a unique idempotency key (a UUID or a hash of the initial payload) for every unique transaction that enters your workflow. You then pass this key along in the API request header, like Idempotency-Key: your-unique-key. The server-side logic must be designed to store and check for these keys. Before creating a new record, it checks if it has ever seen that key before. If it has, it doesn’t perform the action again but instead returns the result of the original, successful request.
This logic shifts the burden of managing retries from a guessing game into a deterministic process. Your workflow can safely retry a failed API call, knowing that even if the original call actually succeeded but the response was lost, the idempotency key will prevent any duplicate side effects.
Building without idempotency keys is an architectural debt that you will eventually have to pay back with hours of manual database cleanup.
Build a Dead-Letter Queue for Unfixable Errors
Some errors are transient. A temporary network failure or an API rate limit can be solved with a simple retry strategy. Other errors are permanent. A malformed payload due to a bug in your transformation logic, or a request for a user ID that has been deleted, will never succeed no matter how many times you retry it. These permanent failures can clog your system, endlessly retrying and consuming resources.
This is what a Dead-Letter Queue (DLQ) is for. After a certain number of failed retries (e.g., 3 or 5), instead of trying again, the workflow logic should move the failed event’s payload and its associated error messages to a separate queue or database table. This is the DLQ. This action immediately clears the main queue, allowing healthy transactions to flow through without interruption.
The DLQ serves as an inbox for engineers. It contains all the transactions that the system could not process automatically. From here, you can manually inspect the payloads, diagnose the root cause of the failure, and decide on a course of action. Maybe the bug needs a code fix, after which you can replay the events from the DLQ. Maybe the data is truly bad and needs to be discarded. The point is that this decision is made by a human, not an endlessly spinning retry loop.
A system without a DLQ is a system that is not designed for failure. It assumes all problems are temporary, which is a dangerous assumption in any distributed architecture.